ApeCoin (APE) has experienced price fluctuations, raising concerns about potential market manipulation by crypto trading firm Wintermute. Data from Arkham reveals dramatic changes in APE’s asset balance, adding to the uncertainty.
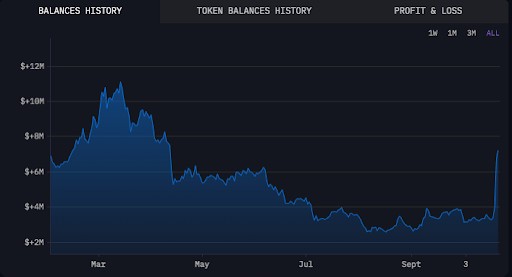
Arkham’s balance history chart shows that APE’s asset value has fluctuated since March 2024. In early March, the asset balance was around $6 million, rising to around $12 million by early April.
However, this peak was followed by a sharp and steady decline, with the balance falling back to roughly $6 million by the end of May.

ApeCoin Price Action and Volatility
Crypto analyst Davie Satoshi weighed in on ApeCoin’s recent price movements. According to Satoshi’s analysis, the launch of APECHAIN and related memecoins contributed to the recent price bump. He identified a “wave 3” bullish pattern with a strong green candle, which indicates short-term price consolidation in a wave 4 triangle pattern.
Rapid Fire Charts: $APE$APE had a nice bump from the APECHAIN release and its memecoins. We see a nice green candle which signified a wave 3. Expect bouncing up and down between current levels of $1.50 and $1.30 as it forms a wave 4 triangle. This will last for a few weeks.… pic.twitter.com/c4B8ehiqMB
— davie satoshi (@NFTdavie) October 21, 2024
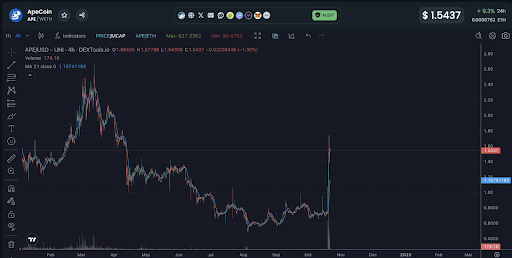
Starting in late February, APE jumped from a low of $1.20 to a peak of $2.80 by late March. After this surge, the price steadily dropped through April and May. By mid-summer, the price hovered around the $1.50 mark, with minor surges but no sustained upward momentum.
In October, APE spiked from $1.20 to $1.54 in just 24 hours, a gain of more than 9%.
Read also: ApeCoin Price Explodes 40% with Layer-3 ApeChain Launch

Satoshi predicts that APE’s price will fluctuate between $1.50 and $1.30 as it forms this triangle over the next few weeks, followed by a possible upward target of $2.50 in a wave 5 breakout.
Technical Analysis Shows Bullish Signals, But Beware of Overbought Conditions
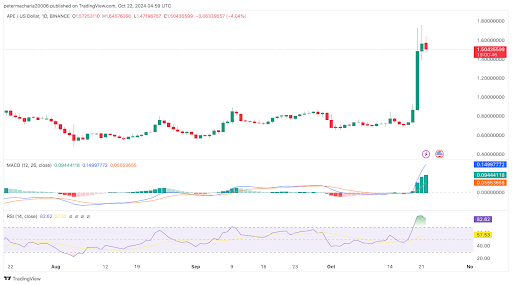
Technical indicators also suggest recent bullish momentum for ApeCoin. The MACD line has crossed above the signal line, pointing to continued upward movement.

However, the RSI has reached 82.62, placing APE in overbought territory, which may indicate a short-term correction.
Disclaimer: The information presented in this article is for informational and educational purposes only. The article does not constitute financial advice or advice of any kind. Coin Edition is not responsible for any losses incurred as a result of the utilization of content, products, or services mentioned. Readers are advised to exercise caution before taking any action related to the company.
 coinedition.com
