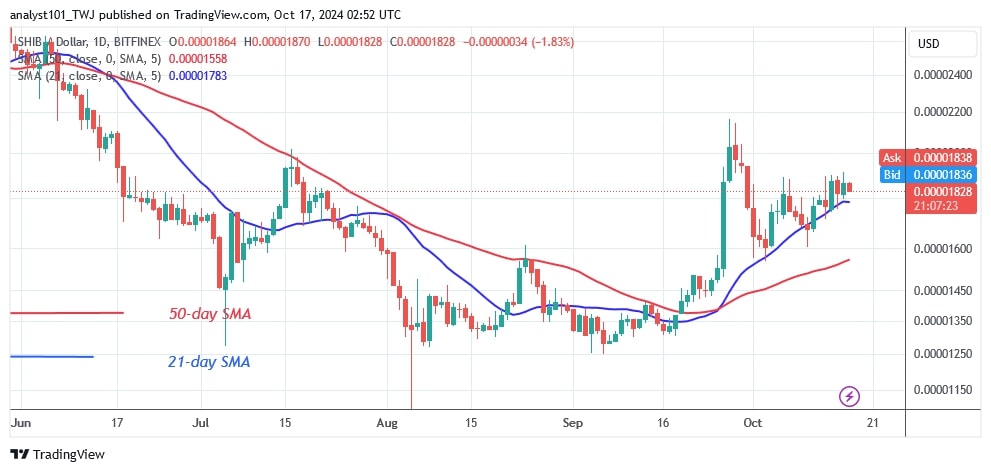
The price of Shiba Inu (SHIB) has resumed its uptrend as it pulls back and finds support above the moving average lines. During the initial surge, the altcoin peaked at $0.00002167 before being pushed back.
Long-term forecast for the Shiba Inu price: bullish
Buyers have failed to sustain the bullish momentum above the high of $0.00002200. The altcoin has retraced above the 21-day SMA support and is preparing for an upside push.
On the upside, SHIB will rally if the 21-day SMA support is maintained. It will rise and retest or break through the resistance at $0.0002200. If buyers succeed, bullish momentum will reach a high at $0.00003600. SHIB will fall if it loses the 21-day SMA support. The market will fall above the 50-day SMA support or the low at $0.00001700.
Analysis of the SHIB indicator
The price bars have been above the moving average lines since September 21, as reported by Coinidol.com. The altcoin is in an uptrend although it has retraced above the 21-day SMA support. The price change is modest due to the existence of doji candlesticks. SHIB will fall if it loses its 21-day SMA support. The moving average lines are trending upwards, which is consistent with the uptrend.
Technical indicators
Key Resistance levels: $0.00001200, $0.00001300, $0.00001400
Key Support levels: $0.00000600, $0.00000550, $0.00000450

What is the next move for Shiba Inu?
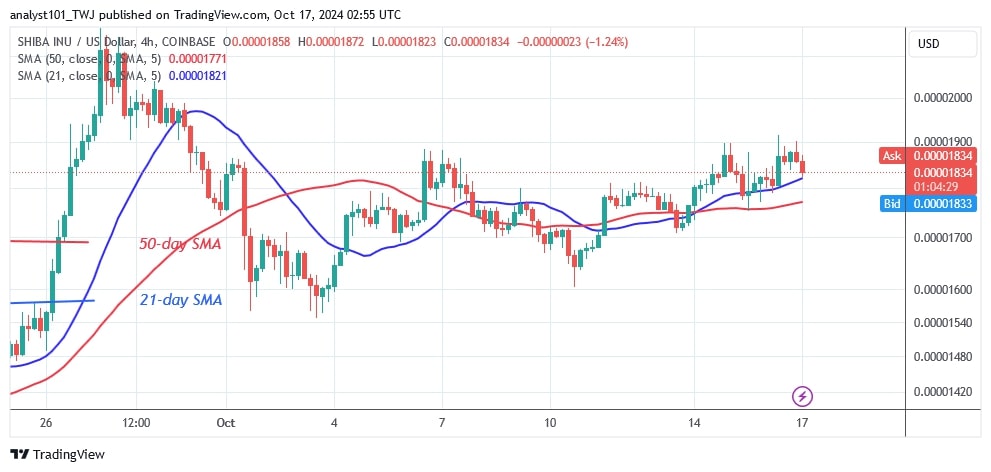
On the 4-hour chart, the altcoin is correcting upwards after falling below the $0.00002200 resistance zone. However, the uptrend has been holding near the $0.00001900 resistance since October 6. SHIB is oscillating below the initial barrier but remains above the moving average lines.

Disclaimer. This analysis and forecast are the personal opinions of the author. They are not a recommendation to buy or sell cryptocurrency and should not be viewed as an endorsement by CoinIdol.com. Readers should do their research before investing in funds.
 coinidol.com