
Tron ($TRX) price is currently exhibiting signs of bullish momentum; however, its price is down, while all the other biggest coins in the market are positive today.
While various indicators show a bullish outlook, there are also signals that point to an important possible turning point for $TRX.
$TRX Ichimoku Cloud Shows a Bullish Momentum
The Ichimoku Cloud chart for $TRX price reveals a generally favorable outlook. Currently, $TRX price remains above the Kumo (cloud), which is typically a positive signal for bullish sentiment. The cloud itself is moderately thick, suggesting a reasonable level of support below the current price if a retracement were to occur.
Additionally, the green Senkou Span A, above the red Senkou Span B, forms a bullish cloud ahead, reinforcing optimism for further gains. The Kijun-sen (red line) lies below the current price, offering support, though its flat trajectory hints at a pause in momentum.
Meanwhile, the Tenkan-sen (blue line) closely follows price action, maintaining a positive outlook for short-term momentum, though a potential bearish signal could arise if it crosses below the Kijun-sen.
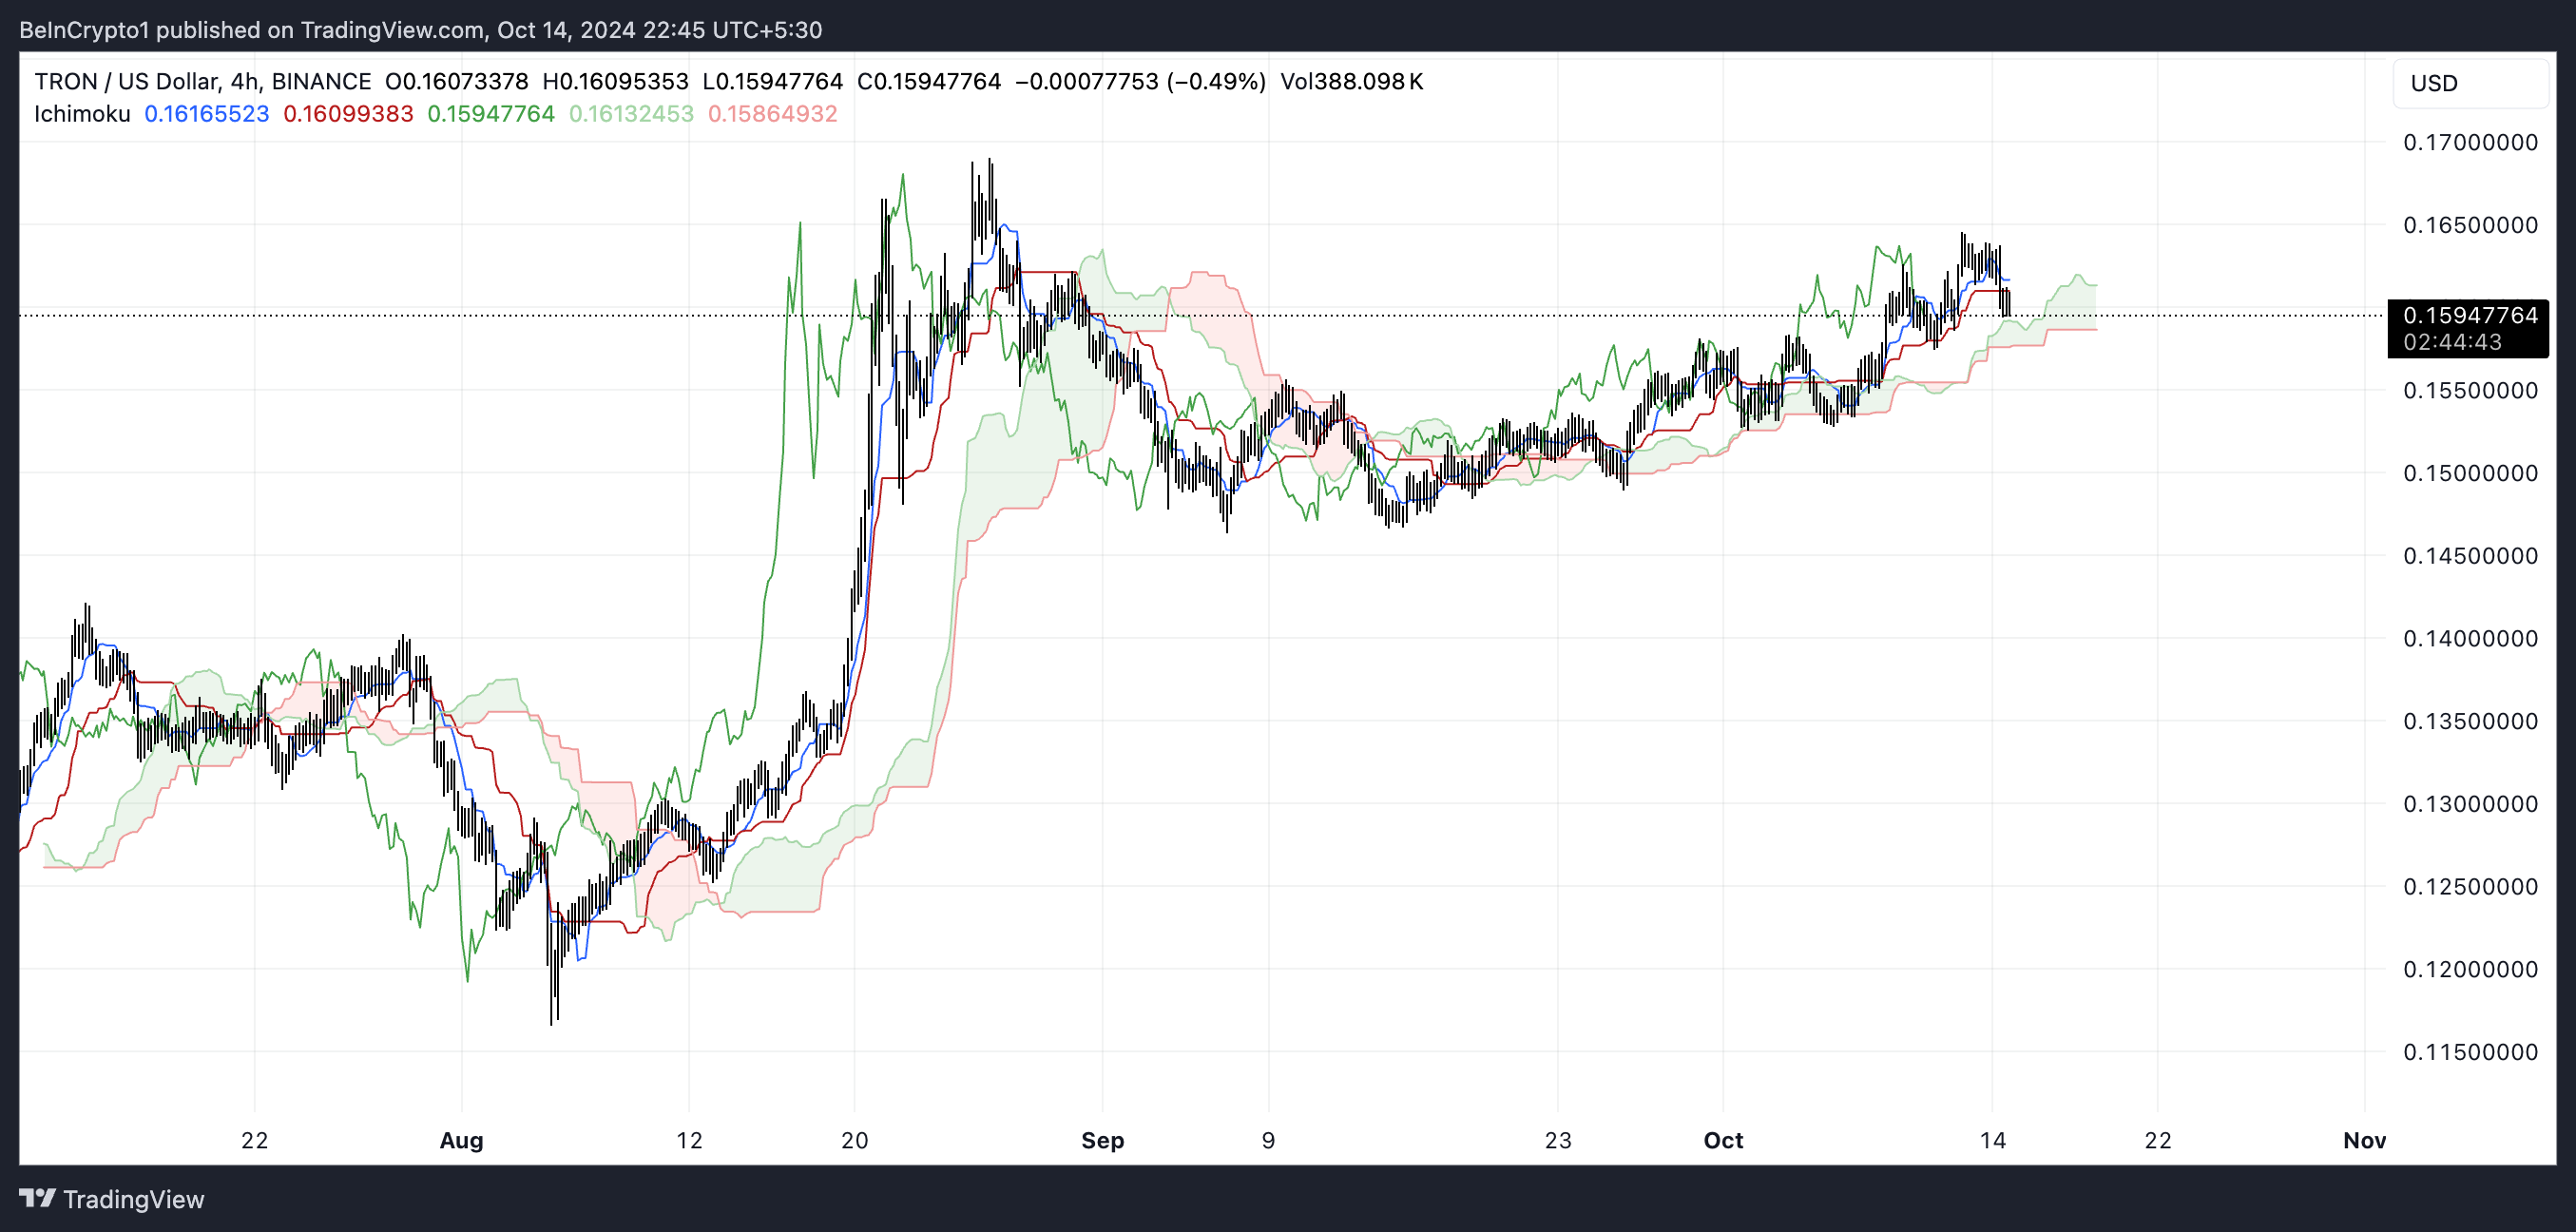
The Chikou Span (green lagging line), which is positioned above the price level from 26 periods ago, further confirms that $TRX’s current trend is backed by positive momentum. However, as the Chikou Span nears the current price level, it signals that the ongoing bullish momentum might face challenges and could enter a consolidation phase.
While the broader sentiment for $TRX remains bullish, the asset appears to be at a pivotal point, requiring either a breakout above resistance or strong support to sustain its upward trajectory.
DMI Suggests Moderate Trend Strength
The Directional Movement Index (DMI) for Tron ($TRX) provides valuable insights into the current trend strength. The yellow line, representing the Average Directional Index (ADX), is currently around 23.8, suggesting a moderate trend strength, though not particularly strong.
The blue line (+DI), which measures the strength of positive price movements, is at 11.3, indicating relatively weak buying pressure at this point. Meanwhile, the red line (-DI), which measures the strength of negative price movements, is slightly higher at 13.3, suggesting that selling pressure currently outweighs buying pressure, though not by a significant margin.
The ADX, which has fluctuated considerably in recent months, shows that $TRX’s trend strength has varied, with some periods of high volatility followed by more subdued phases. The current positioning of the +DI and -DI lines below 20 indicates a lack of significant momentum for either bulls or bears, pointing to a range-bound or consolidative period.
For $TRX to regain a more decisive upward trajectory, the +DI would need to cross above the -DI, combined with an increase in the ADX value above 25, to signal a strengthening trend. Overall, the DMI suggests that while the broader sentiment is slightly bearish, there is room for a potential shift, contingent on increased buying pressure and an improvement in trend strength.
$TRX Price Prediction: Potential Trend Reversal in Play
$TRX’s EMA lines are currently showing a bullish pattern, with short-term EMAs positioned above the long-term EMAs. This setup typically indicates positive momentum and a continuation of the uptrend.
However, the short-term EMA lines are starting to turn downward. This could suggest a potential reversal of the current trend. If this downward shift continues, it may indicate a weakening of buying pressure and a transition toward a more bearish phase for $TRX.
Exponential Moving Averages (EMAs) are a type of moving average that gives more weight to recent data, making them more responsive to the latest price movements compared to Simple Moving Averages (SMAs). Short-term EMA lines reflect recent price behavior, while long-term EMA lines provide a broader view of the overall trend.

If the uptrend continues, $TRX will likely test its next resistances at $0.166 and potentially even $0.169, suggesting room for further gains if buying pressure strengthens.
However, if the trend reverses, as implied by the recent movement of the EMA lines, $TRX may test support levels at $0.155, $0.152, or even as low as $0.1462. These support zones could play a crucial role in determining whether the bearish momentum deepens or if a rebound is possible.