
Conflux (CFX) price has declined by 75% in the past 6 months, disappointing many investors. After the sharp selling, the CFX price dropped to the demand zone, and then the bearish trend halted near the $0.120 mark. CFX sellers made several attempts to drag the price below the crucial $0.120 support level but couldn’t.
The CFX crypto kept declining due to resistance from a descending trendline. Simultaneously, the buyers managed to defend the $0.120 mark, displaying their involvement. Keep on reading to analyze how the Conflux price may react in the demand zone.
Can Small Risks Trigger a Massive Move in CFX Price?
Anoniem (@AnoniemXBT) is a crypto analyst who has pointed out that history can be repeated. The CFX crypto witnessed sharp buying in early 2023 and it repeated the same scenario this year.
If we manage to go risk-on again like last year Q4 then we could get some decent moves.$CFX has just be hanging around this level where it pulled a 4x from last year
— Anoniem (@AnoniemXBT) September 17, 2024
In my opinion it’s a good level to accumulate for spot/swing if you think we get bull mode pic.twitter.com/f32ufOygBe
The CFX price has reached the previous support level of $0.120 from where it was lifted by 4x. It generated a buying signal when it reached the crucial breakout level of $0.150. It is in the good zone for the bullish forecast.
CFX Price Analysis Based on the Technical Indicators
When writing, the MACD generated a bullish crossover with the Signal line and traveled to the positive territory. The histograms have turned green, which could invite buyers.
The RSI displayed a bullish divergence and headed toward the overbought zone by taking support on the RSI-based moving average. Further analysis of technical indicators helped in Conflux price prediction.
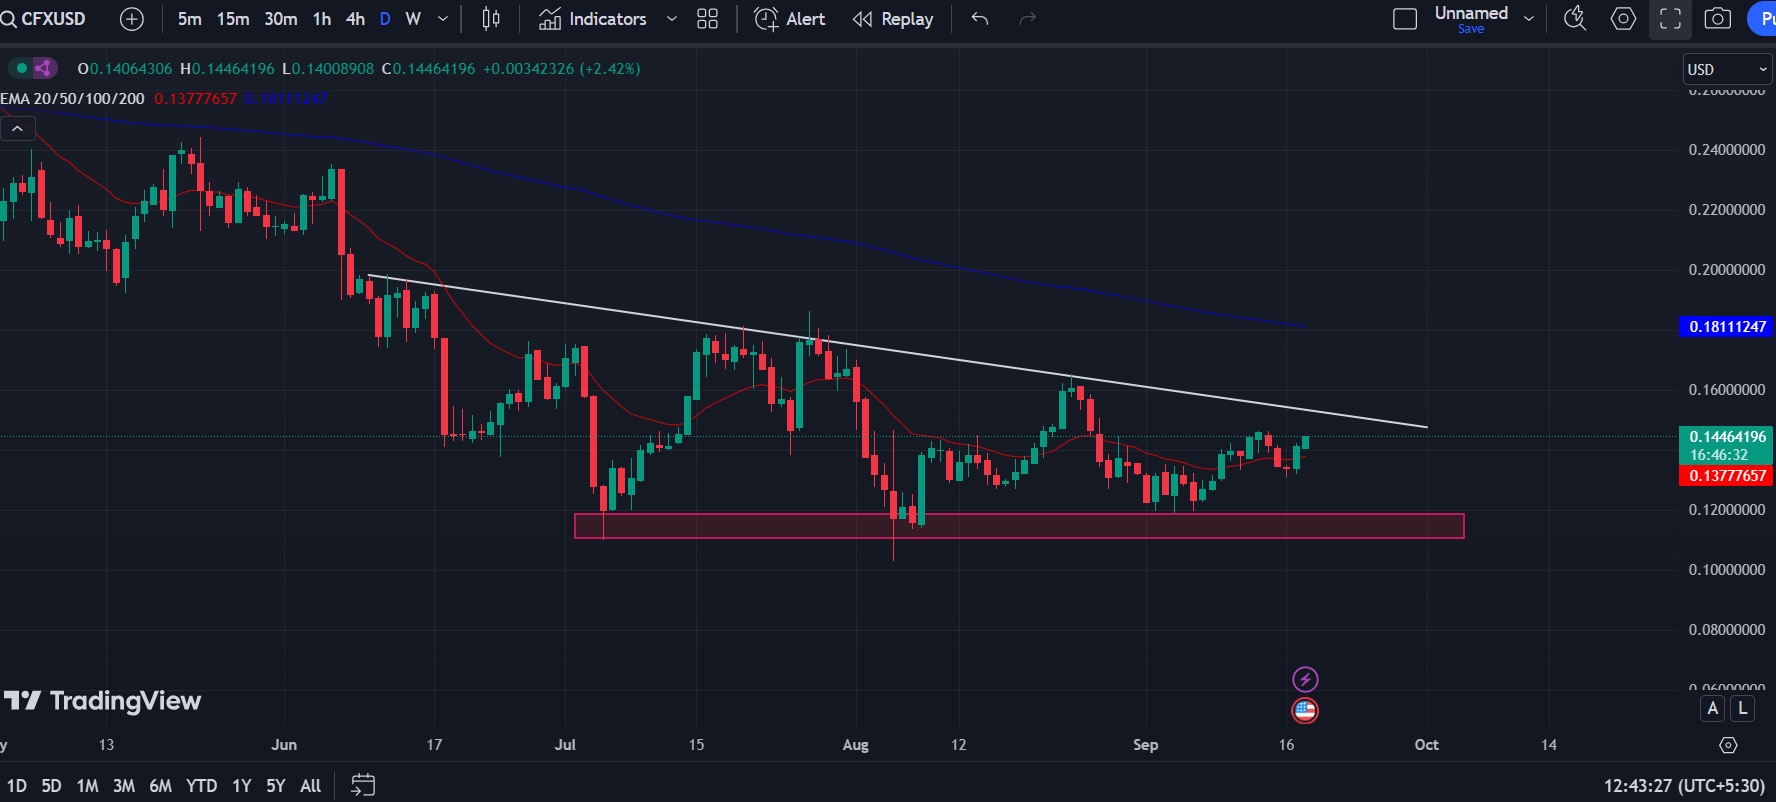
Source: CFX/USD Price Chart on 1-D TF by TradingView
The CFX price traded at $0.144 at the time of writing after rising 2.42% in the past 24 hours. This token’s market capitalization was $636.45 Million. Moreover, its 24-hour trading volume was $24.09 Million.
The Conflux price has shaped a descending triangle pattern over the daily time frame. However, the CFX crypto has reached a crucial breakout level by exceeding the 20-day exponential moving average (EMA).
Suppose this crypto asset’s price surpasses the descending trendline, it could generate a buying signal and tempt buyers. If the price smashes the 200-day EMA, investors may show interest which could result in a bullish trend for the long-term.
On the other hand, if the CFX crypto price faces resistance from the trend line, it may melt to the major support level. If the price starts trading below the major support level, sharp selling might occur, and the price will go down.
Conflux Token Price Analysis
The analysis suggests that the CFX price was at a crucial point at press time. It got the potential for a bullish breakout if it surpasses the descending trendline and the 200-day EMA.
Technical indicators, such as the MACD and RSI, showed bullish signals, and the price has also displayed bullish momentum in the demand zone.
However, it’s important to monitor the price closely, especially if it starts trading below the major support level. That move can lead to the sharp selling of the token. Additionally, the historical buying patterns and the formation of a descending triangle pattern add layers to the analysis.