- The Polygon price analysis is bullish today.
- Resistance for MATIC is present at $2.49.
- Support for MATIC is present at $2.42.
The Polygon price analysis is bullish today as the coin got support at $2.43, and the price bounced to $2.46. MATIC was in correction from 2nd January, and a stronger correction was observed yesterday as well. We anticipate MATIC to break above $2.49 resistance in the coming hours, after which MATIC bulls will march towards their next target of $2.55.
MATIC/USD 1-day price chart: MATIC recovers after taking a plunge towards 2.43
The 1-day Polygon price analysis shows bullish results with the coin trading hands at $2.46 at the time of writing. The crypto pair is still at a loss of 1.51 percent in value over the last 24 hours and a loss of 7.62 percent in value over the past week. But the trading volume has increased by more than 29 percent. However, the market cap has decreased by 1.09 percent during the last 24 hours.
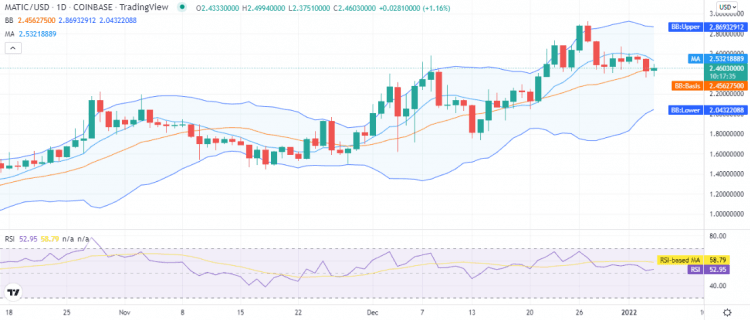
The Volatility for MATIC is high but now decreasing, with the lower side of the Bollinger bands showing more convergence. The upper band is present at the $2.86 mark representing resistance, and the lower band is present at the $2.04 mark representing support. The average of the Bollinger bands is present at the $2.45 mark, just below the price level.
The relative strength index (RSI) is trading in the upper half of the neutral zone at index 52. The indicator’s slight upwards curve indicates the buying activity in the market.
Polygon price analysis: Latest developments and further technical indications
The 4-hour Polygone price analysis shows the price breakout was downwards following a retracement from yesterday, but a bullish period spanning over eight hours was also observed today. However, the price has decreased again during the last four hours, but the bullish performance is still in dominating position.
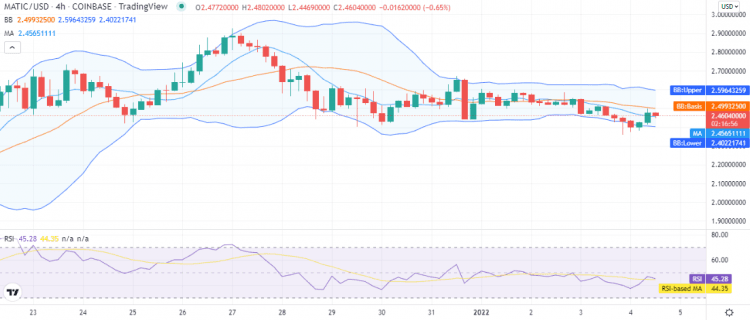
The volatility is mild on the 4-hour chart, as the Bollinger bands continue to form a relatively narrow channel. The upper band is at the $2.59 mark representing resistance, and the lower band is at the $2.40 mark representing the strongest support for MATIC. The moving average (MA) is at the $2.45 mark below the price level. The relative strength index (RSI) is trading in the lower half of the neutral zone at index 45, the downwards curve of the indicator indicates the selling activity that just started again in the market, but there are chances for buying to overwhelm the bearish side in the coming hours.
Polygon price analysis: conclusion
The Polygon price analysis is bullish today as the price has improved up to $2.46. We anticipate MATIC to continue higher side for the next 24 hours, and MATIC/USD seems to be breaking above $2.49 in the coming hours as well.
Disclaimer. The information provided is not trading advice. Cryptopolitan.com holds no liability for any investments made based on the information provided on this page. We strongly recommend independent research and/or consultation with a qualified professional before making any investment decisions.