
LayerZero ($ZRO) is under renewed selling pressure, with its price sliding toward $3.19 after being rejected at a key trendline. The sharp downturn has shifted market sentiment to a more bearish outlook, sparking concerns about deeper declines. With bears seemingly in control, all eyes are on whether $ZRO can find support or if it will continue to drop.
This article aims to analyze the recent bearish move of $ZRO following a trendline rejection, as the price tumbles toward the critical $3.19 level. We’ll explore the key technical indicators, market dynamics, and potential scenarios to provide traders and investors with insights into whether the bearish trend will continue or if a recovery might be on the horizon.
As of the time of writing, LayerZero is trading around $3.73, marking a 5.94% decline, with a market capitalization of over $410 Million and a trading volume exceeding $100 million. In the past 24 hours, $ZRO’s market cap has decreased by 5.99%, and its trading volume has dropped by 0.57%
Market Sentiment Shifts: LayerZero Set For Further Declines
On the 4-hour chart, following a successful trendline rejection, LayerZero has continued to gain negative momentum, dropping below the 100-day Simple Moving Average (SMA) toward the $3.19 support level. The digital asset has maintained a steady downward move, indicating that the bears are in control and could push the price even lower.
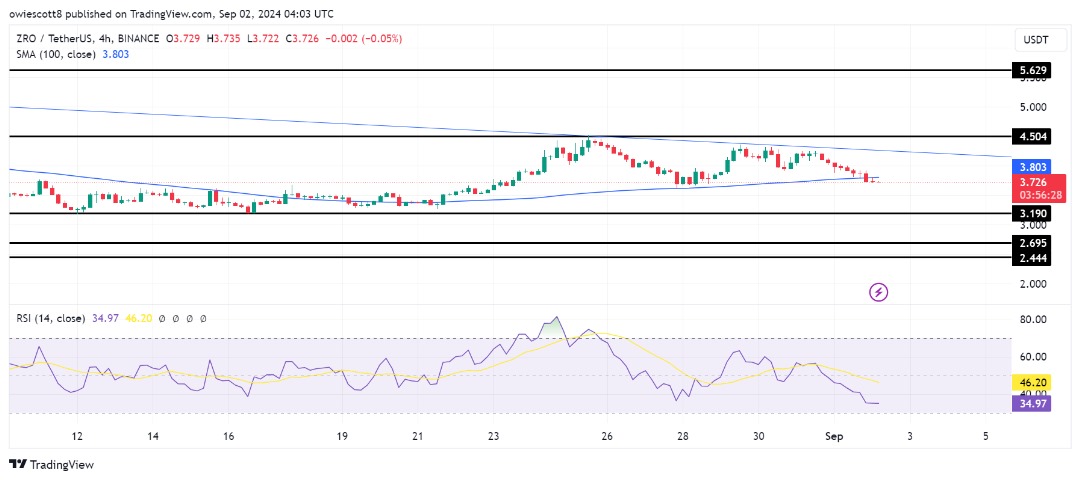
Also, the 4-hour Relative Strength Index (RSI) analysis reveals that the signal line has dropped below 50% toward 35%, indicating a pessimistic market shift. This suggests that $ZRO may continue to experience downward movement as momentum builds.
On the 1-day chart, after the trendline rejection, LayerZero shows promising negative signs marked by the formation of a significant bearish candlestick in the previous trading session. The rejection at the trendline indicates increased selling pressure, which could lower $ZRO’s price in the days ahead as market sentiment continues favoring the bears.
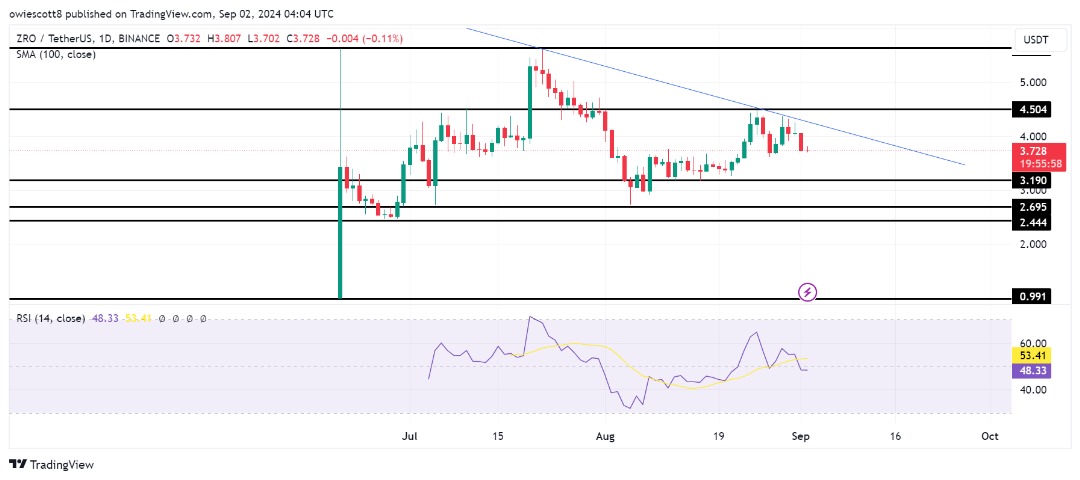
Finally, on the 1-day chart, the RSI signal line has dipped to 47%, slightly falling below the 50% threshold. This decline below 50% indicates that momentum is leaning toward the bearish side and could signal further downside movement in $ZRO’s price.
Key Levels To Watch: Support Or More Downside For $ZRO?
As LayerZero continues through its bearish phase, the $3.19 support level becomes crucial in determining its potential for a rebound or further decline. If $ZRO holds above this key support, it could set the stage for a rise toward the $4.5 resistance level. Should the price break through this resistance, it may rally, aiming for the next resistance point at $5.6 and potentially reaching even higher levels.
However, if the $3.19 support level fails to hold and the price breaks below this threshold, the cryptocurrency could face additional declines, potentially moving toward the $2.69 range. A breach of this level might signal a more downward trajectory, possibly testing even lower support levels.