The FTM coin price action faces rejection near the $2.60 mark, resulting in a bearish reversal and hints at a 25% downfall.
Fantom explores an innovative consensus mechanism that is scratch-built to allow Defi and other related services based on smart contracts.
Lachesis mechanism offers more capacity and two-second transaction finalization, in addition to security enhancements over the traditional Proof-of-Stake (PoS) algorithms-based platforms.
Let us move ahead to read about the Fantom technical analysis.
Past Performance of FTM
FTM coin price breaks above the $2 barrier with a price jump of more than 90% in the past two weeks. The bull run breaks multiple bearish barriers but struggles to rise above $2.60. The coin price retraces to retest the bullish breakout of horizontal levels and zones. Therefore, a bullish reversal with lower price rejection is possible.
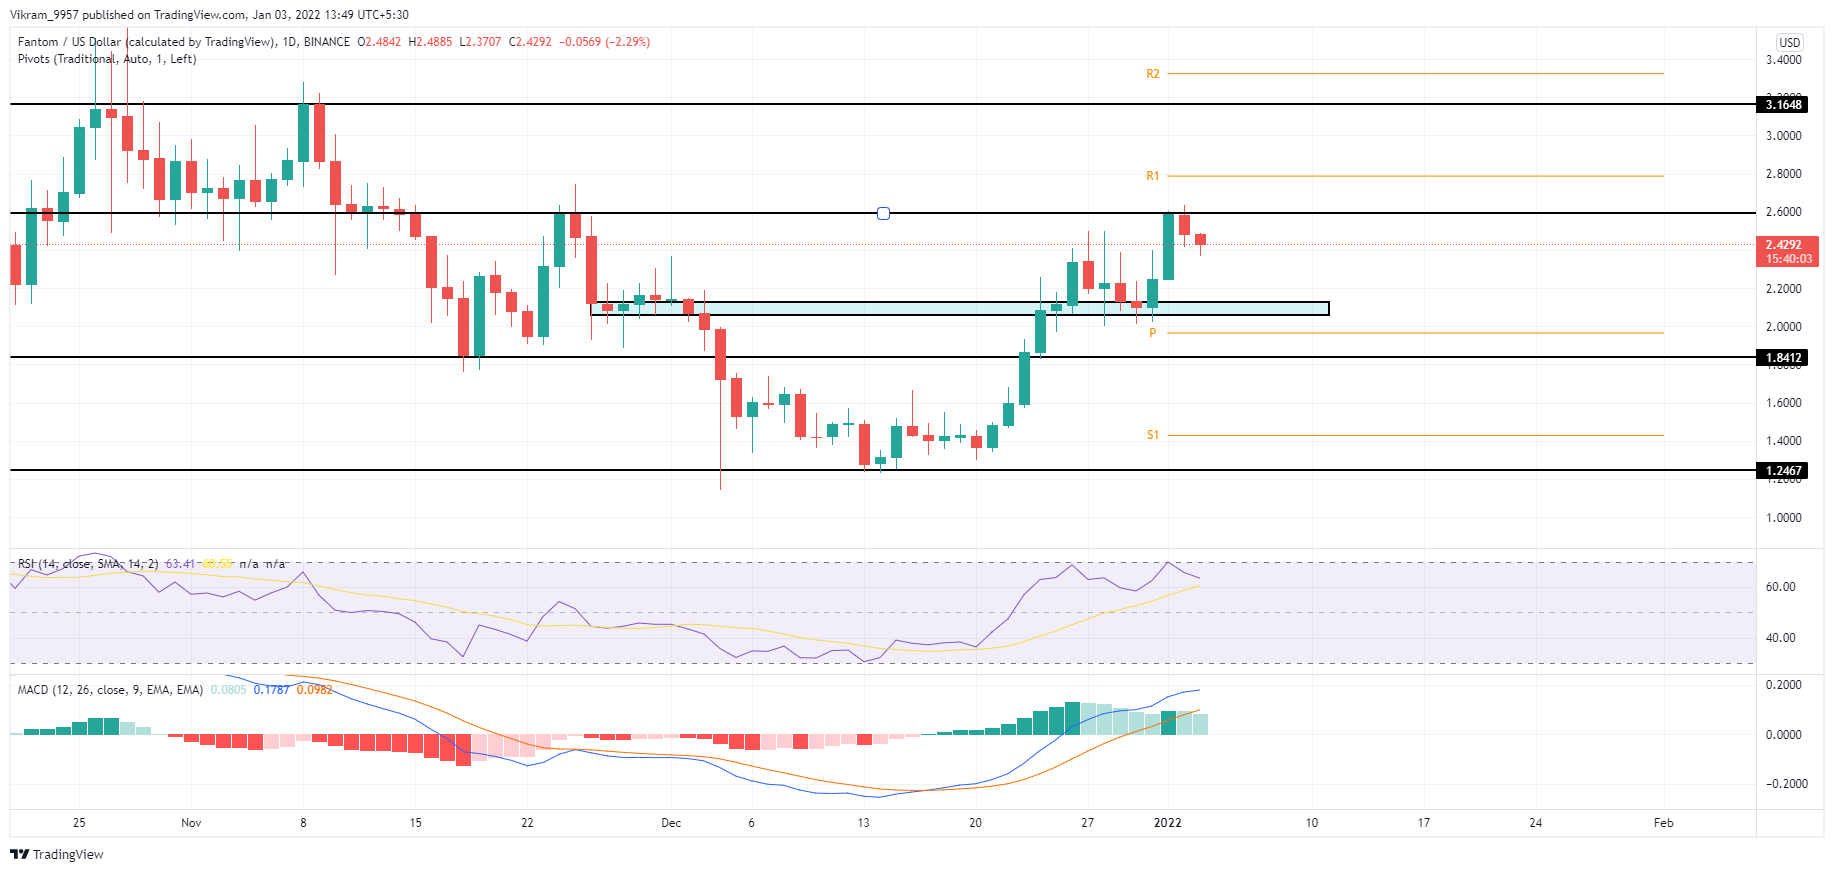
FTM/USD Daily Chart
FTM Technical Analysis
The rising FTM coin price faces rejection near the $2.60 mark in the daily chart, reflecting a strong influence of sellers at the horizontal level. However, the retracement also shows the possibility of a Rising three methods candlestick pattern, which can drive the prices higher.
The breakout of $2.60 will drive the prices higher to the $3.15 or $3.5 levels if the buying pressure sustains. And, on the opposite end, the support level is at $1.25 below the $1.85 level.
The RSI indicator at 63% shows a retracement from the overbought boundary towards the central line in the daily chart. The slope showcases a bearish divergence in the past two peaks.
The MACD indicator shows a decrease in the distance between the MACD and signal lines in the daily chart. Moreover, the weakness in the histogram trend teases a bearish reversal.
Upcoming Trend
The FTM coin price action shows a bearish reversal from $2.60 but the possibility of a bullish takeover sustains. However, the technical indicators are bearish, signaling an imminent danger of a downfall.
Therefore, traders need to be patient till any of the mentioned crucial levels give a breakout before taking a trade.