Chainlink (LINK) has been hovering around $10 for several days, reflecting a 25.91% decline over the past month.
Amid heightened market volatility, holders remain hopeful for a recovery. However, futures traders appear to be betting on a different outcome.
Traders Show Little Faith in Chainlink
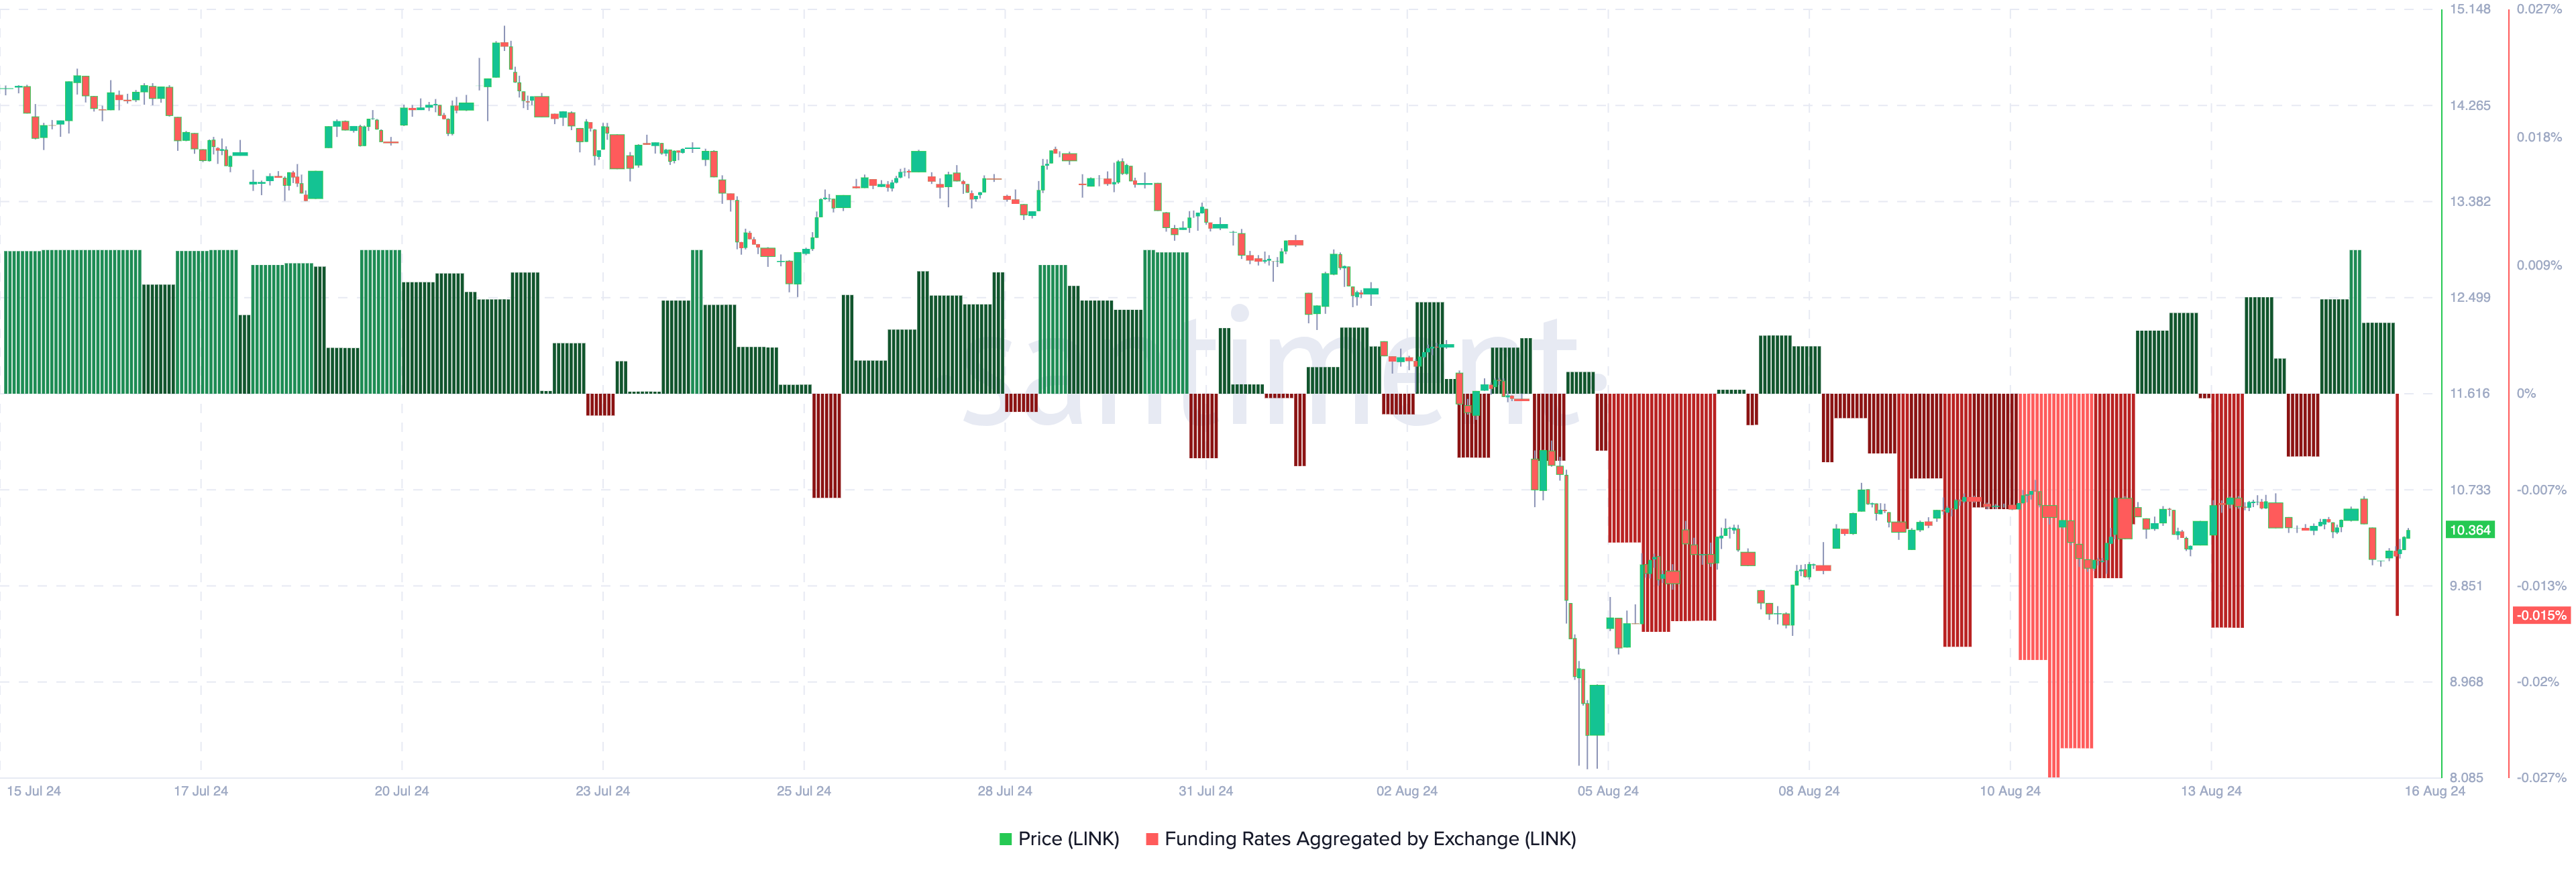
According to Santiment, Chainlink’s Funding Rate plunged to -0.015% earlier today. The Funding Rate serves as an indicator of trader sentiment. When positive, it suggests that longs are paying shorts to maintain their positions, signaling optimism for a price recovery.
On the other hand, a negative Funding Rate indicates dominance by short positions, with broader expectations of a price decline.
Previously, the market’s average position was long. However, as shown in recent data, traders briefly shifted toward shorts between August 14 and 15. During this period, LINK’s price dropped from $10.72 to $9.93 before experiencing a slight rebound.
Read more: Chainlink ETF Explained: What It Is and How It Works

If this pattern rhymes with the last, then it is possible for the token’s value to tank. However, considering other indicators gives more insights into the potential price movement. To do this, BeInCrypto examines the Liquidation Heatmap.
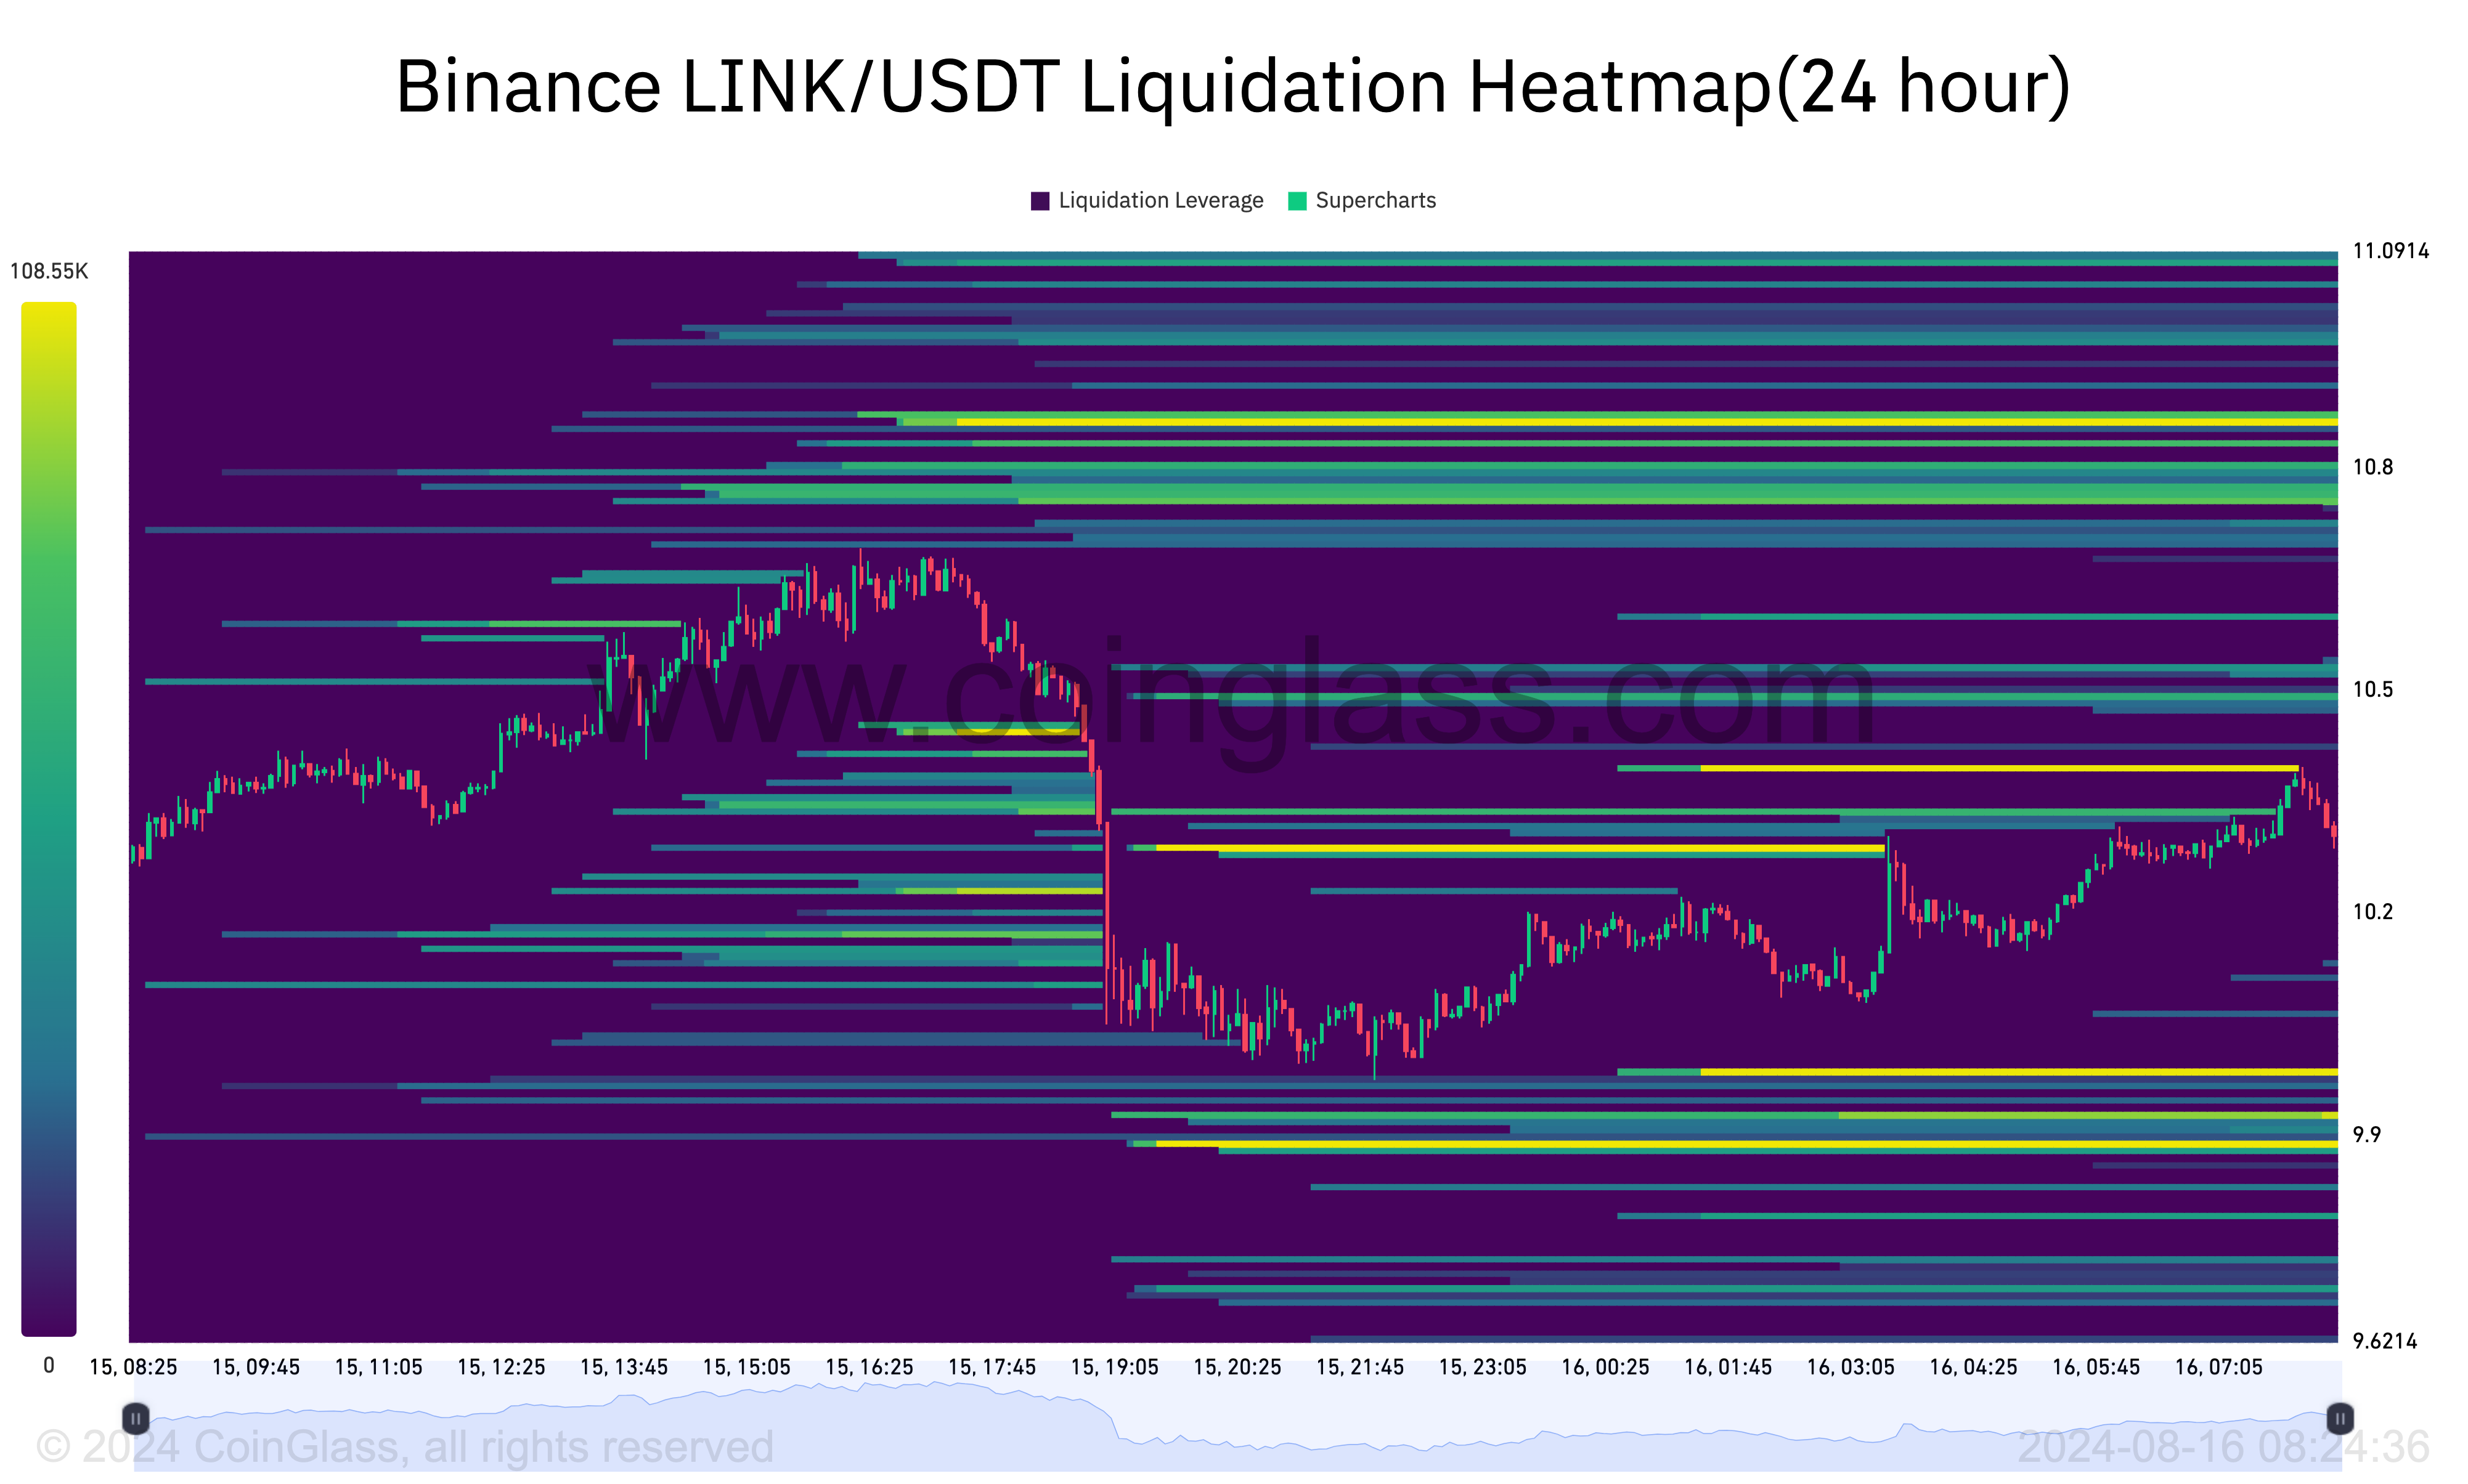
The Liquidation Heatmap identifies spot price levels where significant liquidations might occur. Additionally, it highlights areas of high liquidity, offering traders insights into potential future price movements.
When liquidity clusters at a specific range, prices often gravitate toward that range. Typically, the heatmap’s color transitions from purple to yellow, indicating high liquidity zones.

For LINK, the 24-hour liquidation heatmap shows heavy liquidity concentrations around $9.88 and $9.97. If selling pressure intensifies, LINK’s price could drop toward these levels.
However, on the upside, price levels at $10.39 and $10.86 also show a high liquidity concentration, suggesting that the token may head toward these zones if buyers take control.
LINK Price Prediction: Failure to Hold $10 May Lead to $8
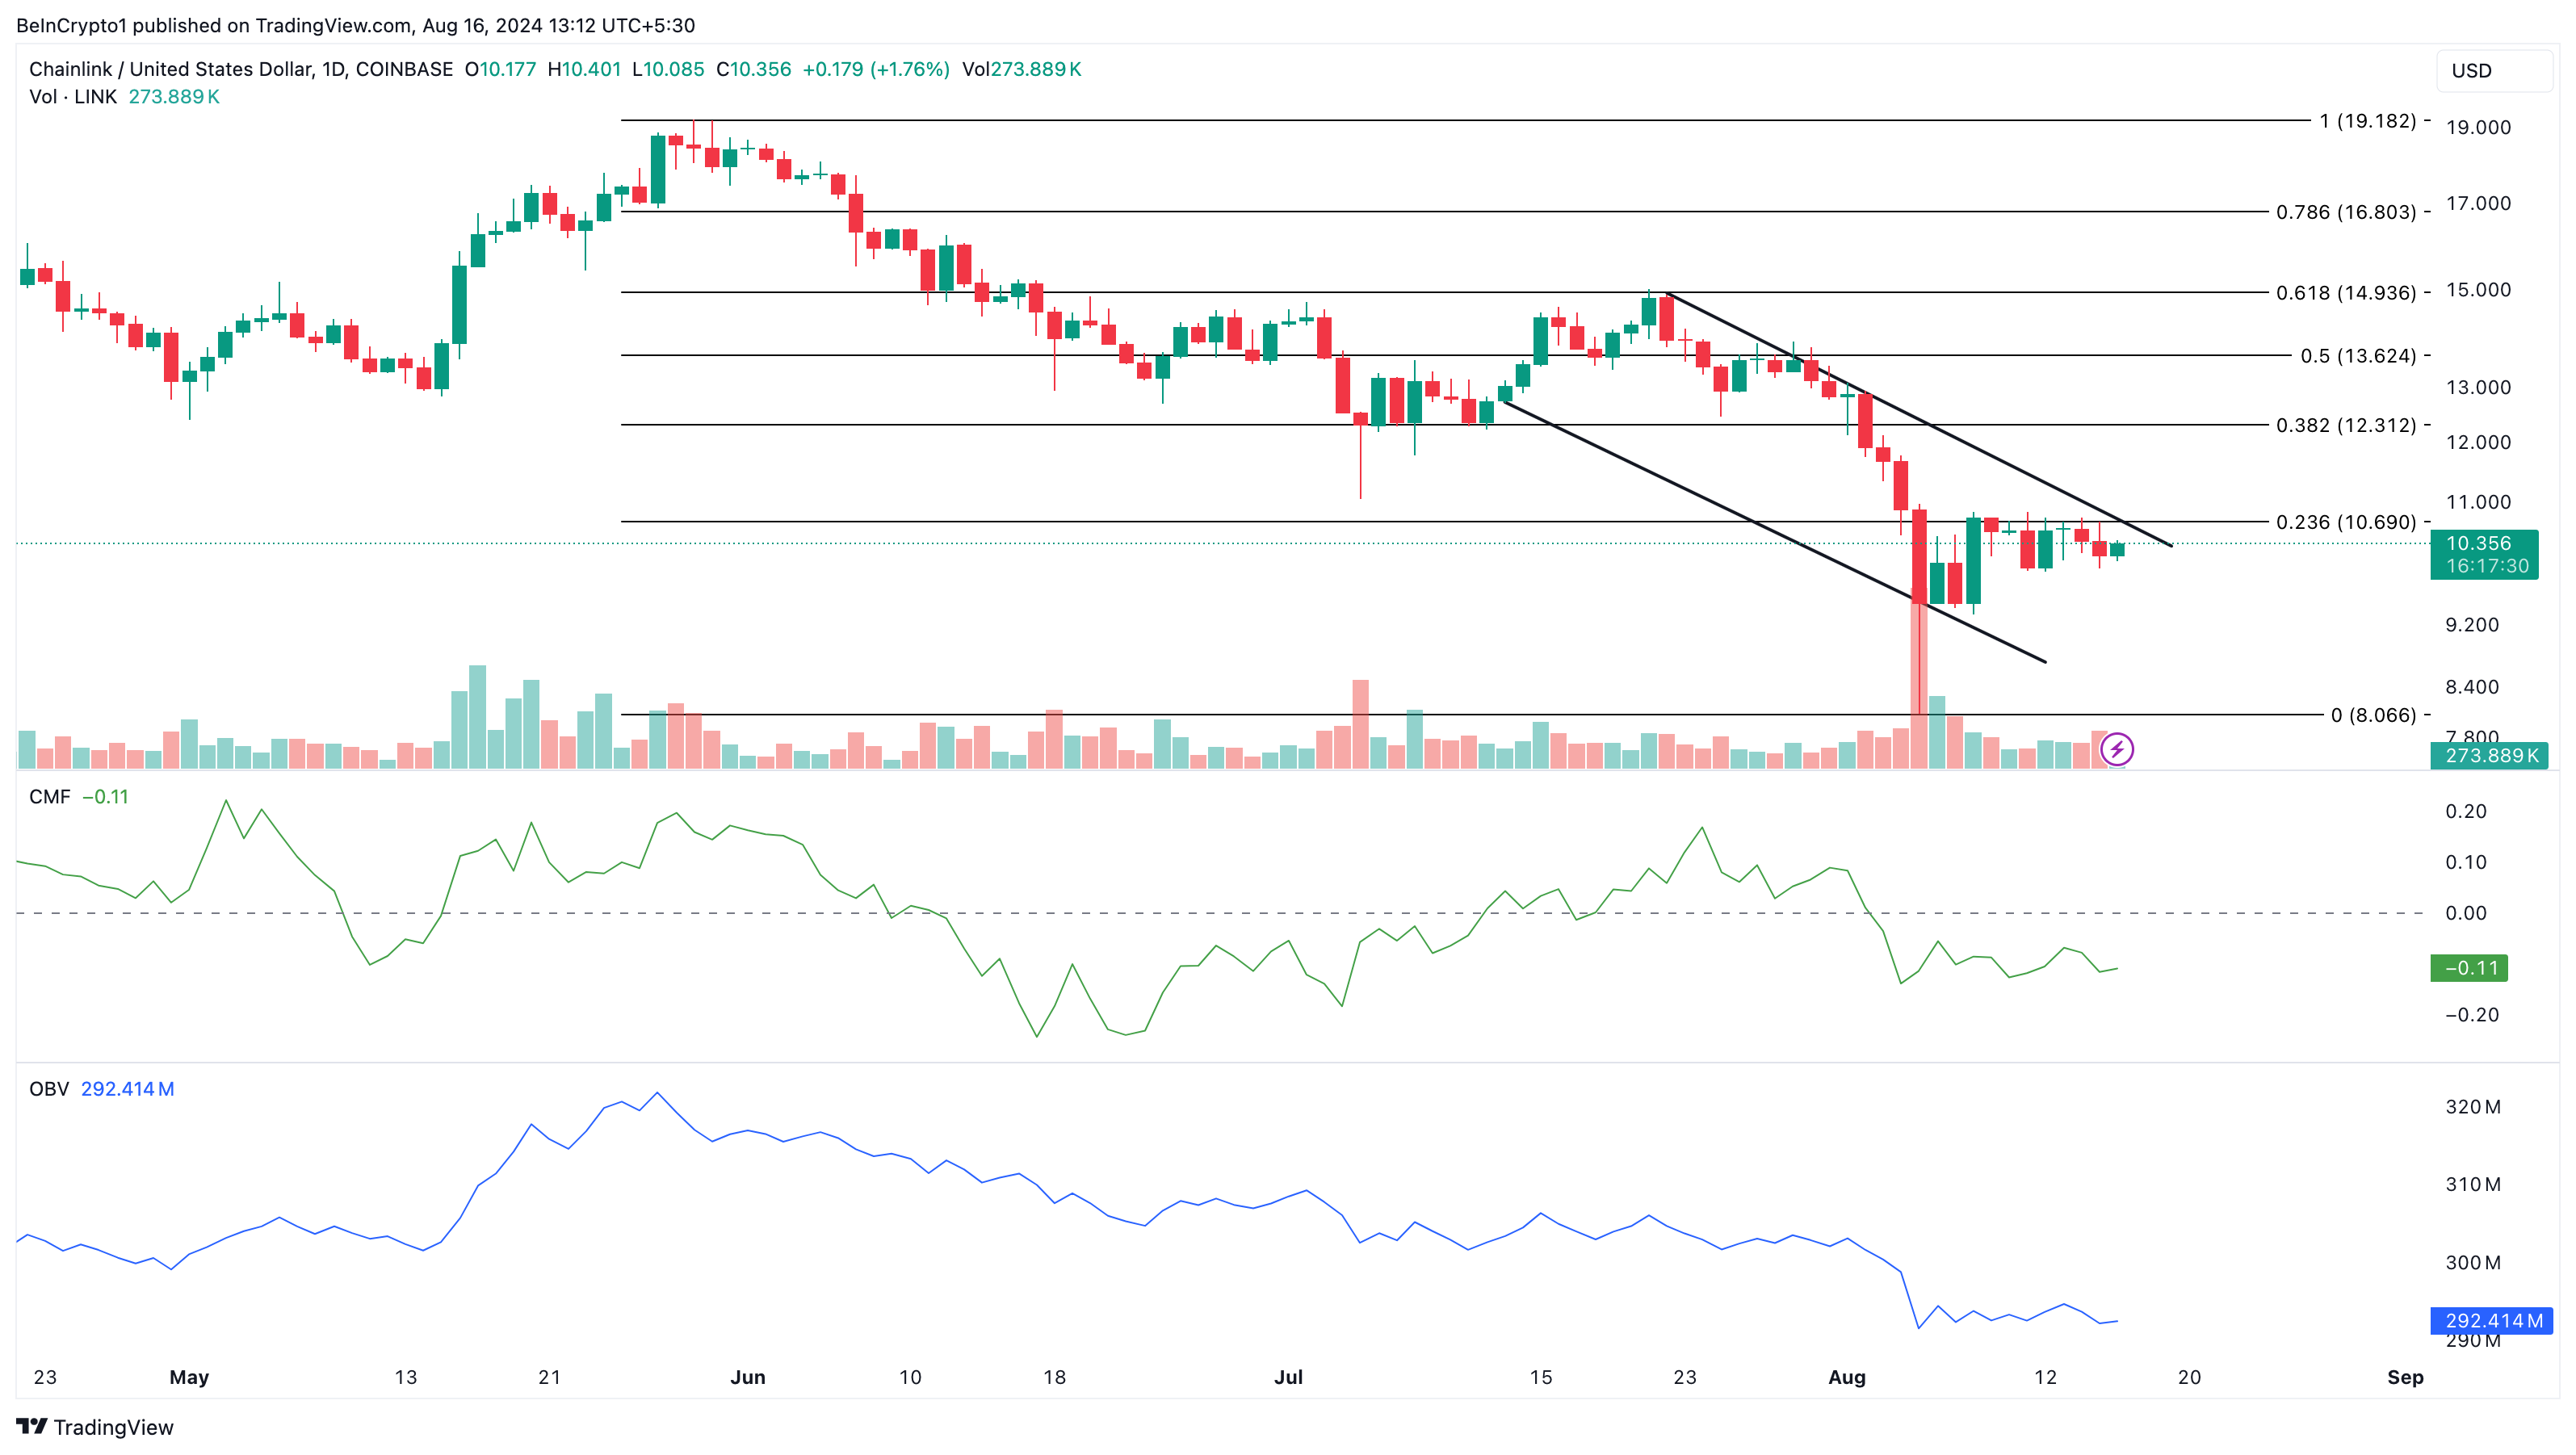
From a technical perspective, Chainlink has been trading within a descending channel since late July. Additionally, the On Balance Volume (OBV), which tracks buying and selling pressure, has decreased.
The drop in OBV signals increased distribution, suggesting that more investors are selling than buying. If this trend continues, LINK’s price could dip further below $10.32. Similarly, the Chaikin Money Flow (CMF) is also down.
Like OBV, the CMF distinguishes between accumulation and distribution phases. An upward reading indicates accumulation, while a decline points to ongoing distribution, reinforcing the bearish outlook.
Read more: Chainlink (LINK) Price Prediction 2024/2025/2030

Given that LINK is currently experiencing distribution rather than accumulation, it indicates that the cryptocurrency is struggling to attract the liquidity needed to break out of its downtrend. If this continues, LINK’s price could drop further to $8.06.
An increase in buying pressure could, however, reverse the current downtrend. If accumulation rises, LINK could retest the $10.69 level, with the possibility of a price climb to $12.32.
 beincrypto.com