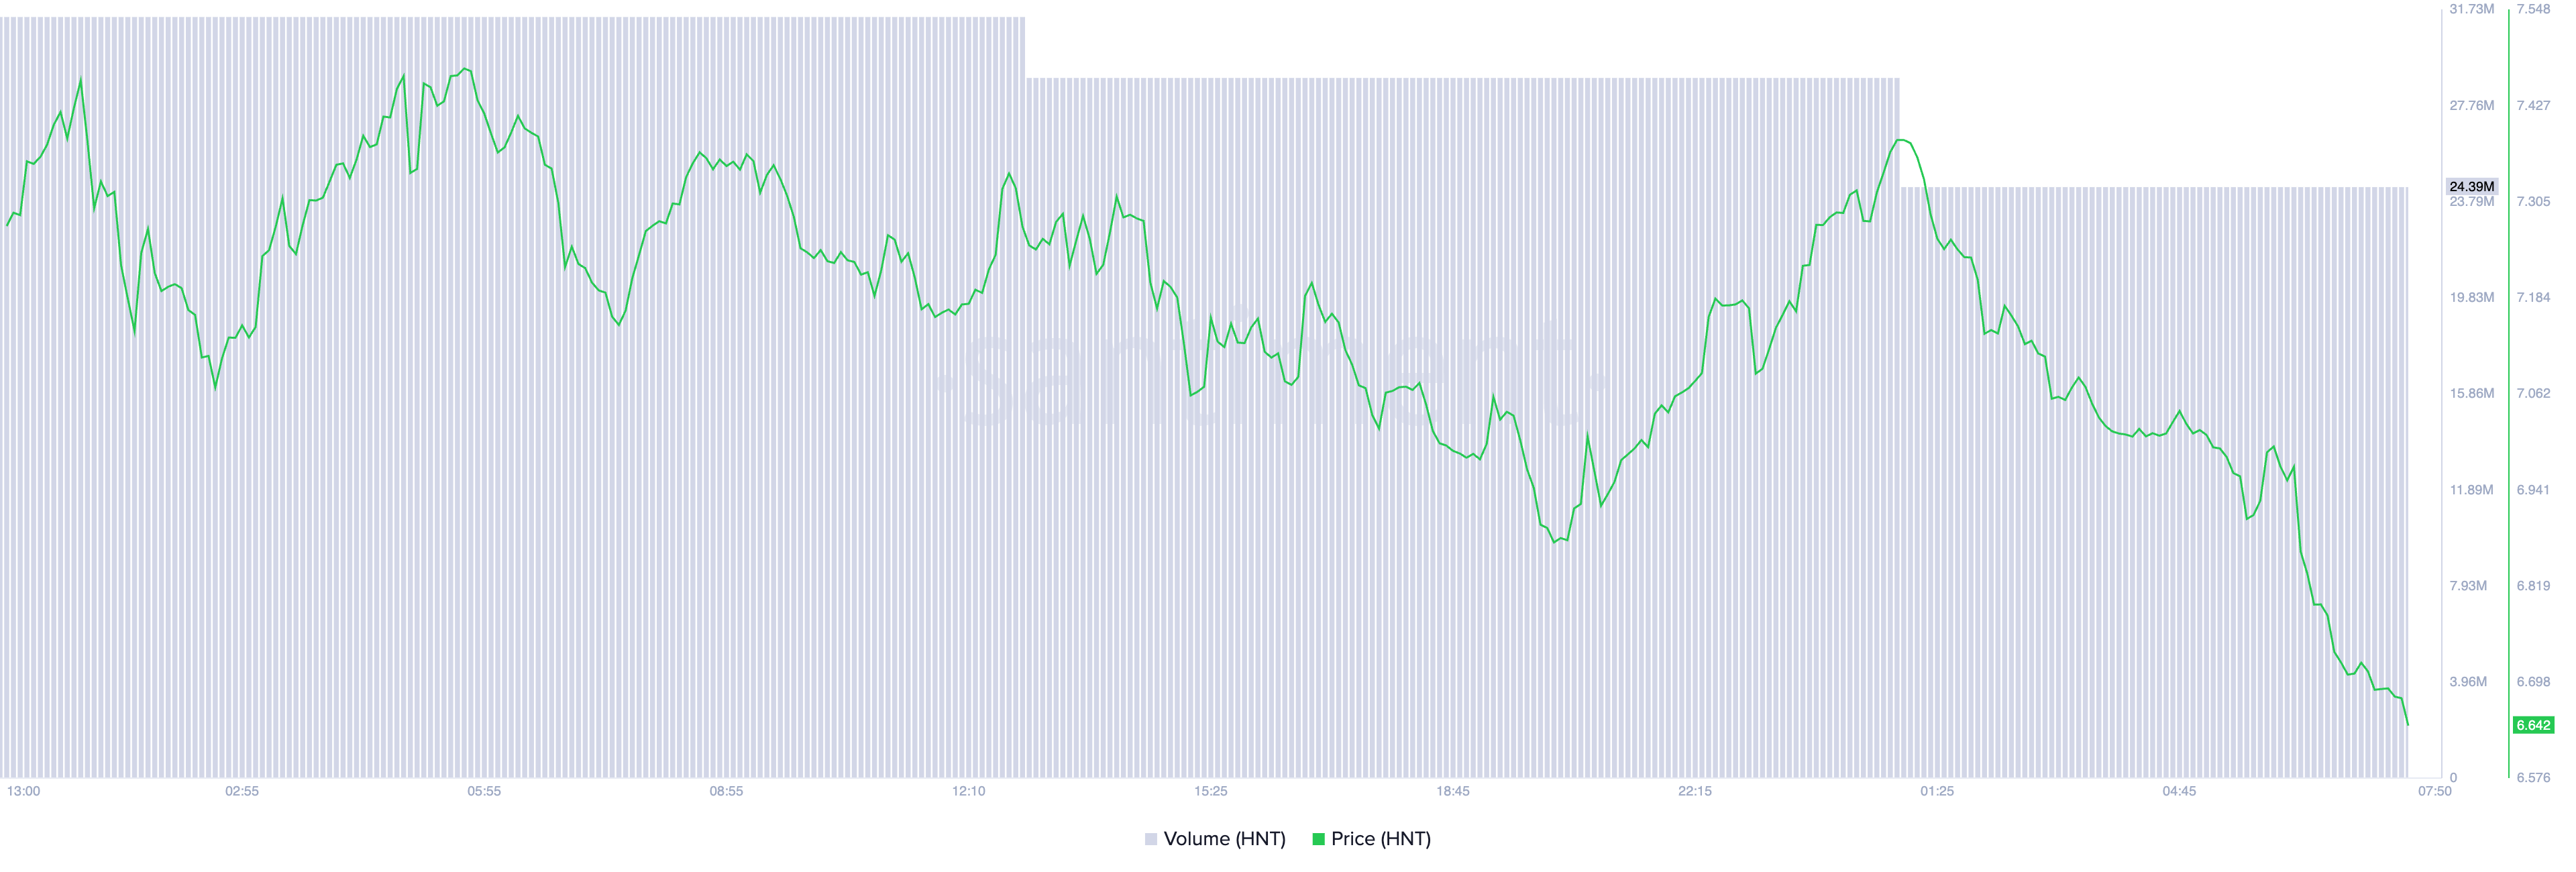
Helium (HNT) has experienced a volatile day. The price initially spiked to $7.37 before sharp selling pressure drove it down.
As of now, the altcoin is trading at $6.72, marking an 8% decline in the past 24 hours.
Helium Declines, But There Is a Catch
The 8% drop in HNT’s price is paired with a notable decline in trading volume, which fell by 26% to $24 million during the same period. When both an asset’s price and trading volume decrease, it typically reflects waning interest and demand. This suggests fewer buyers are willing to invest, leading to reduced transaction activity.
In market analysis, this scenario is generally viewed as a bearish signal, indicating that the asset could continue trending downward as investor confidence fades and selling pressure remains dominant.

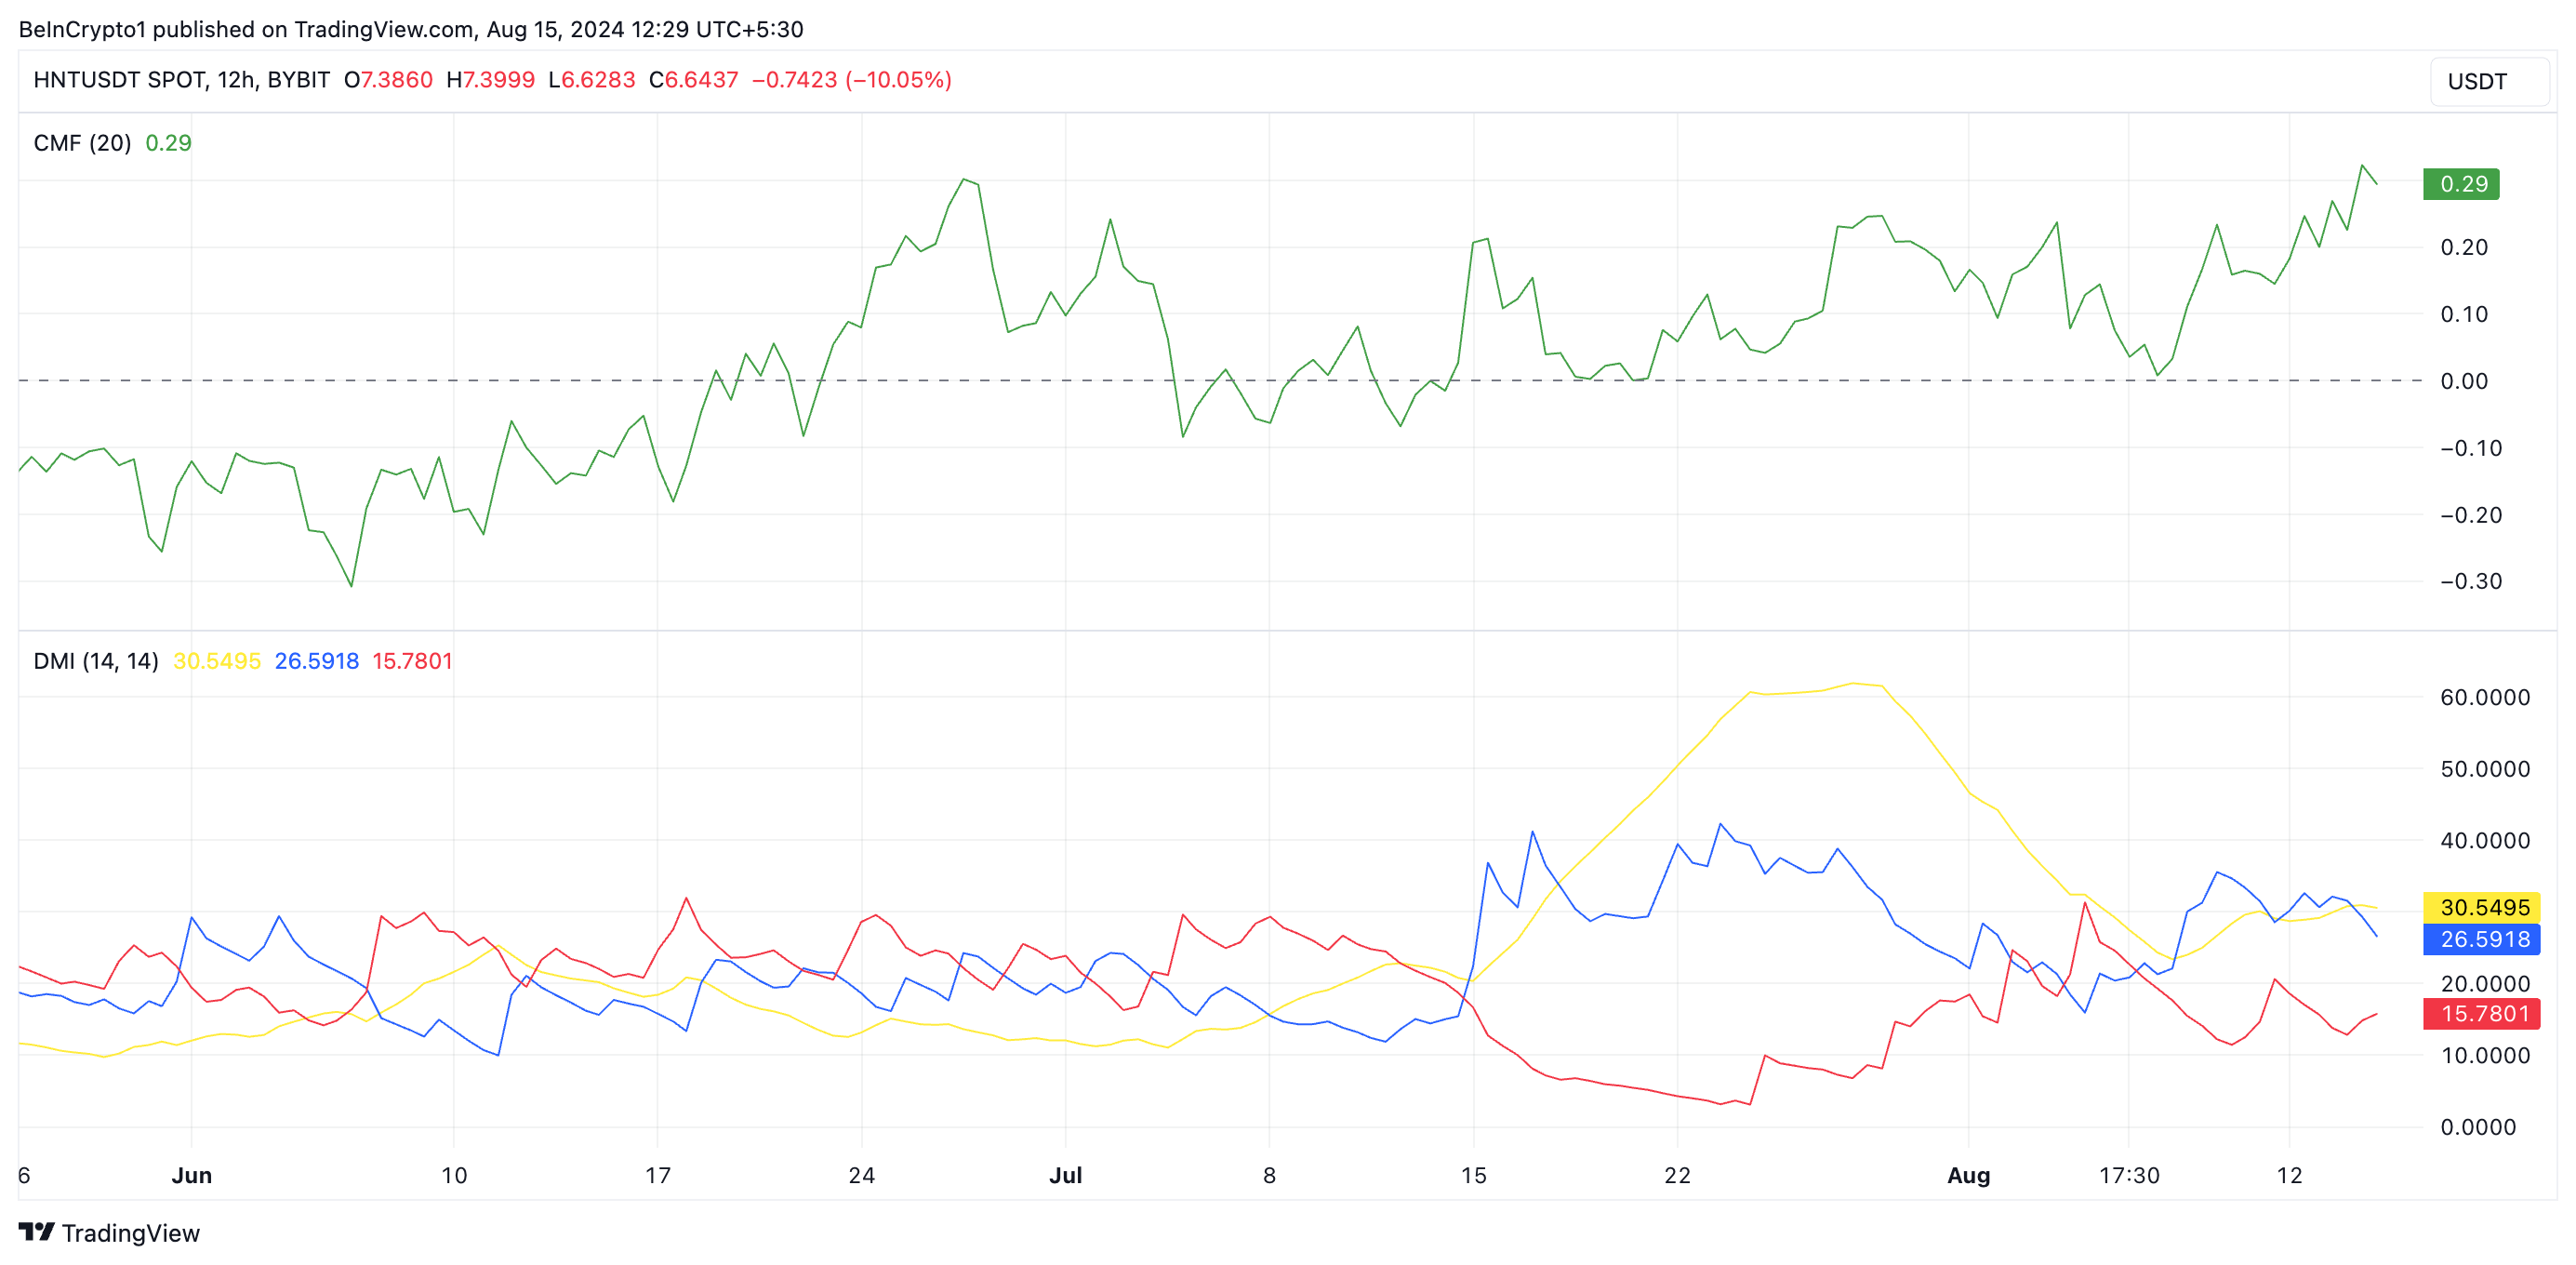
Despite the recent surge in HNT sell-offs, the bullish sentiment around the altcoin remains strong. BeinCrypto’s analysis of the 12-hour chart supports this outlook.
The Directional Movement Indicator (DMI) shows HNT’s positive directional indicator (+DI) positioned above the negative directional indicator (-DI). Investors use the DMI to gauge the strength and direction of a trend. When the +DI exceeds the -DI, it typically signals bullish market conditions dominated by buying pressure.
This setup suggests that although HNT is currently experiencing a price pullback, the overall trend remains upward. In fact, HNT has surged by 34% over the past week, and the positioning of the DMI indicates that the uptrend is still intact despite the temporary decline.
Read More: Helium (HNT) Price Prediction 2024/2025/2030

Additionally, the Chaikin Money Flow (CMF) indicator shows no significant liquidity outflow from the HNT market. The CMF, which tracks money flow into and out of an asset, currently sits at a positive 0.29, reflecting ongoing buying interest. This further supports the view that the recent dip is likely a short-term correction rather than a reversal of the broader bullish trend.
HNT Price Prediction: Buyers and Sellers Have a Battle to Fight
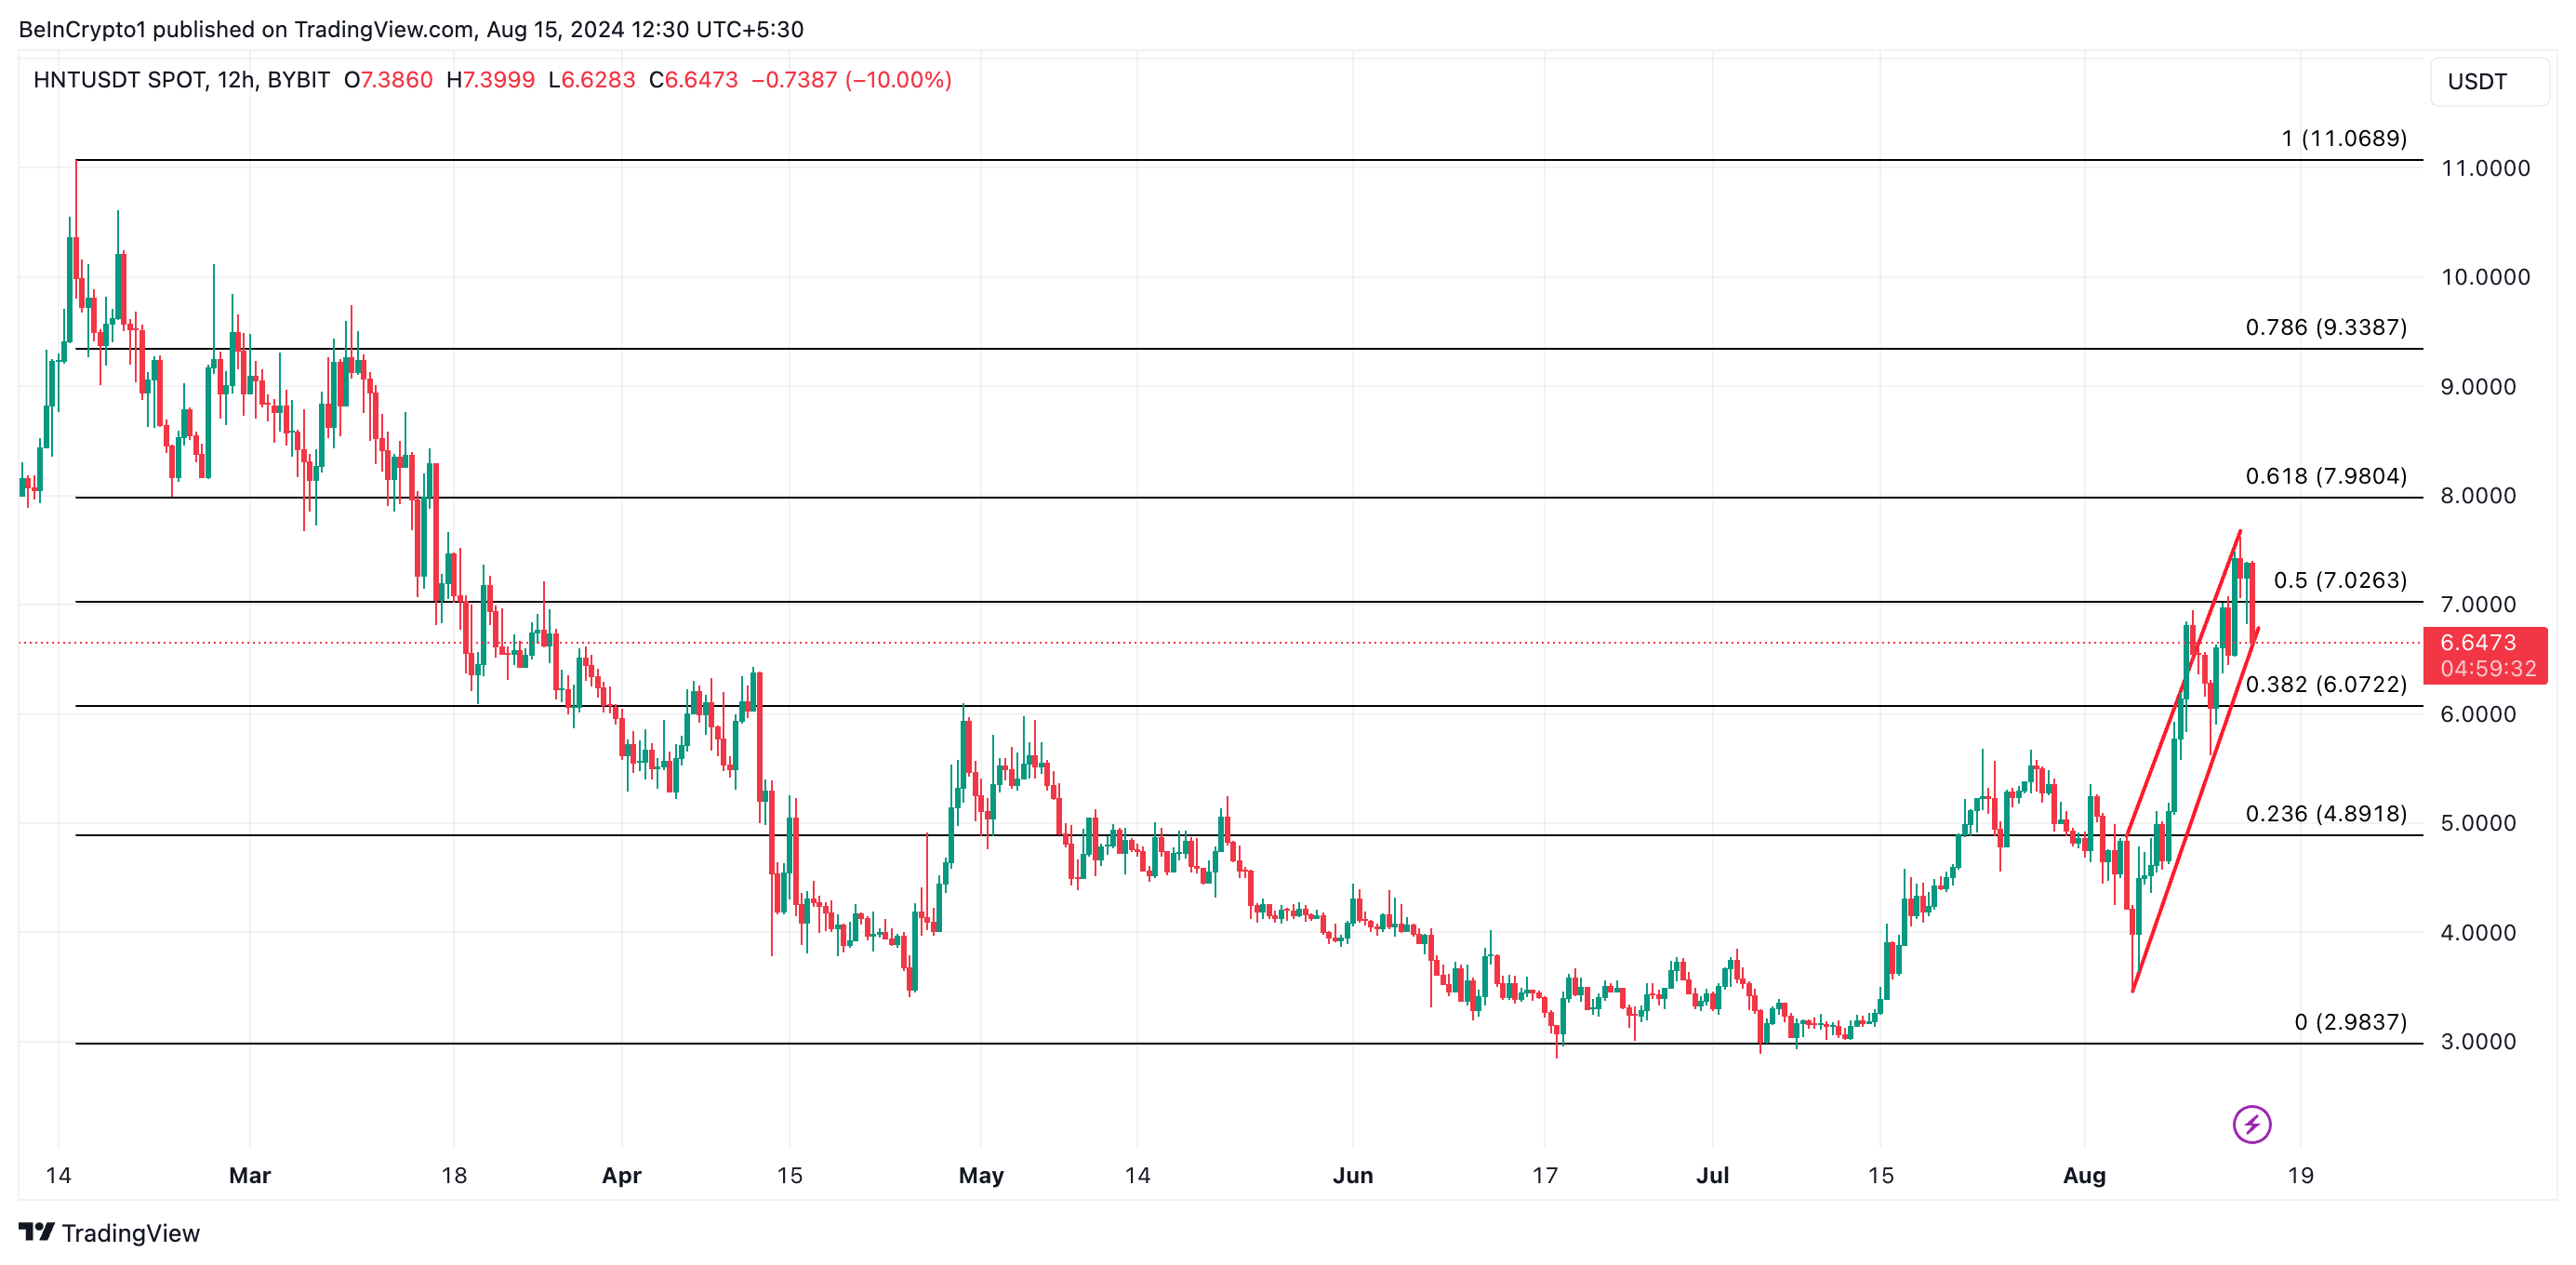
Since August 4, HNT has trended within an ascending channel. This pattern is a bullish signal formed when an asset’s price moves between two upward-sloping parallel lines. Since trading within this bullish pattern, its price has climbed by over 50%.
If the buying momentum reflected by the DMI and CMF indicators continues, HNT could rebound and rally toward the $7.00 price level, with the next target being $7.03.
Read more: Which Are the Best Altcoins To Invest in August 2024?

However, the decline may persist if selling pressure intensifies, potentially pushing HNT down to $6.01.
 beincrypto.com
