Crypto analyst, CryptoYapper, reported notable activity in Bittensor (TAO) and Solana (SOL). Both coins have experienced considerable price movements and increased trading volumes, capturing the attention of cryptocurrency traders and analysts.
$TAO Bouncing !🚀📈#TAO finally retested the previous resistance as support.
— Crypto Yapper (@CryptoYapper) August 6, 2024
We also retested horizontal support
This level is strong, so we're now seeing a bounce.#BittensorTAO is up for more than 50% in the last 24 hours !👀 pic.twitter.com/kG0R2tTTDJ
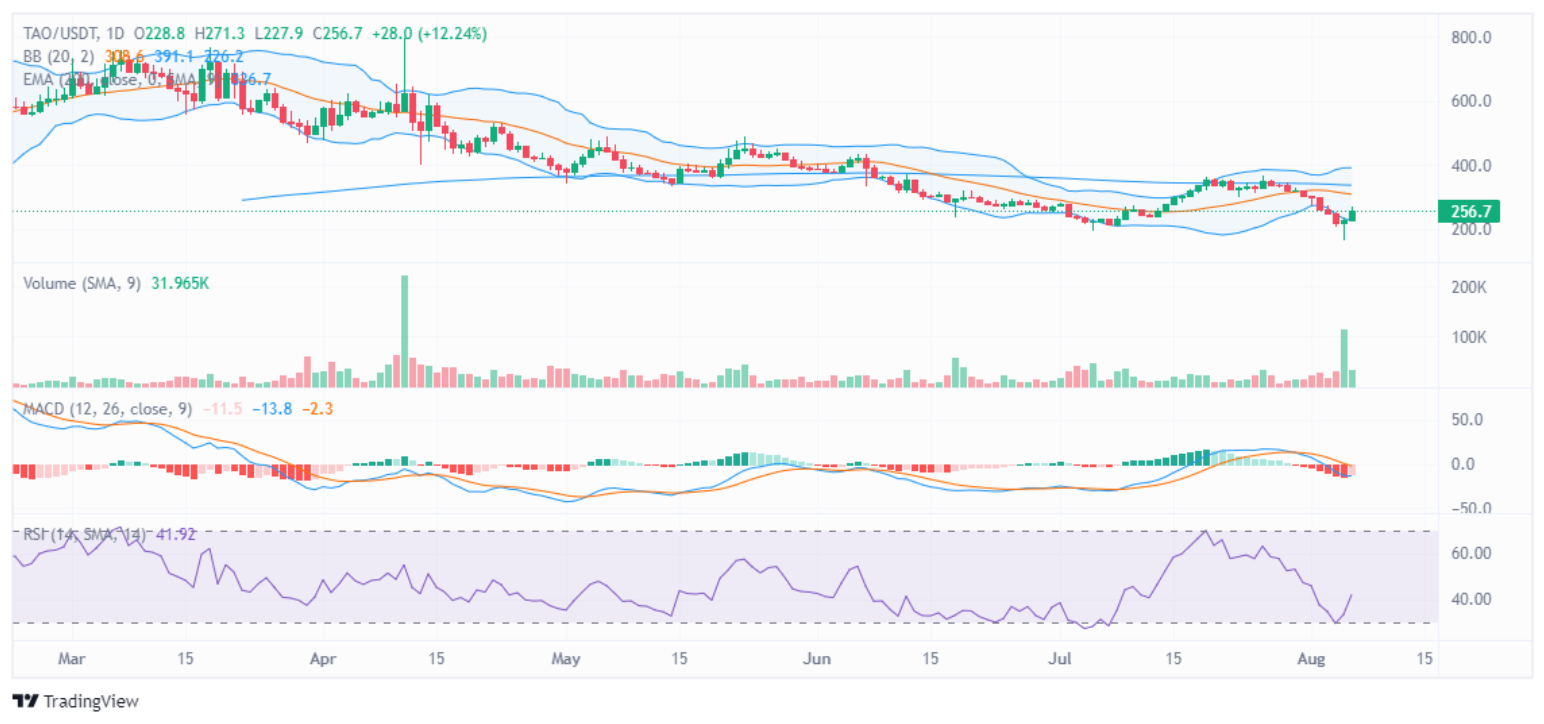
Bittensor’s recent performance has been particularly striking with Yapper observing TAO retesting its previous resistance as support, indicating a strong bounce. The price surged over 50% in the last 24 hours.
Currently, TAO is priced at $259.23, with a 24-hour trading volume of $106,879,54 and a market cap of $1,861,977,973. The coin has a circulating supply of 7,182,613 TAO and a maximum supply of 21,000,000 TAO.
Furthermore, technical analysis reveals key indicators for TAO. The price has crossed above both the 20-day and 50-day moving averages; a bullish signal. Bollinger Bands show the price breaking above the upper band, suggesting upward momentum.

Source: TradingView
Additionally, trading volume has spiked, indicating increased activity. The MACD shows negative values but an uptick, suggesting a potential bullish shift. The RSI stands at 42.37, recently rising from oversold levels, supporting the bullish outlook.
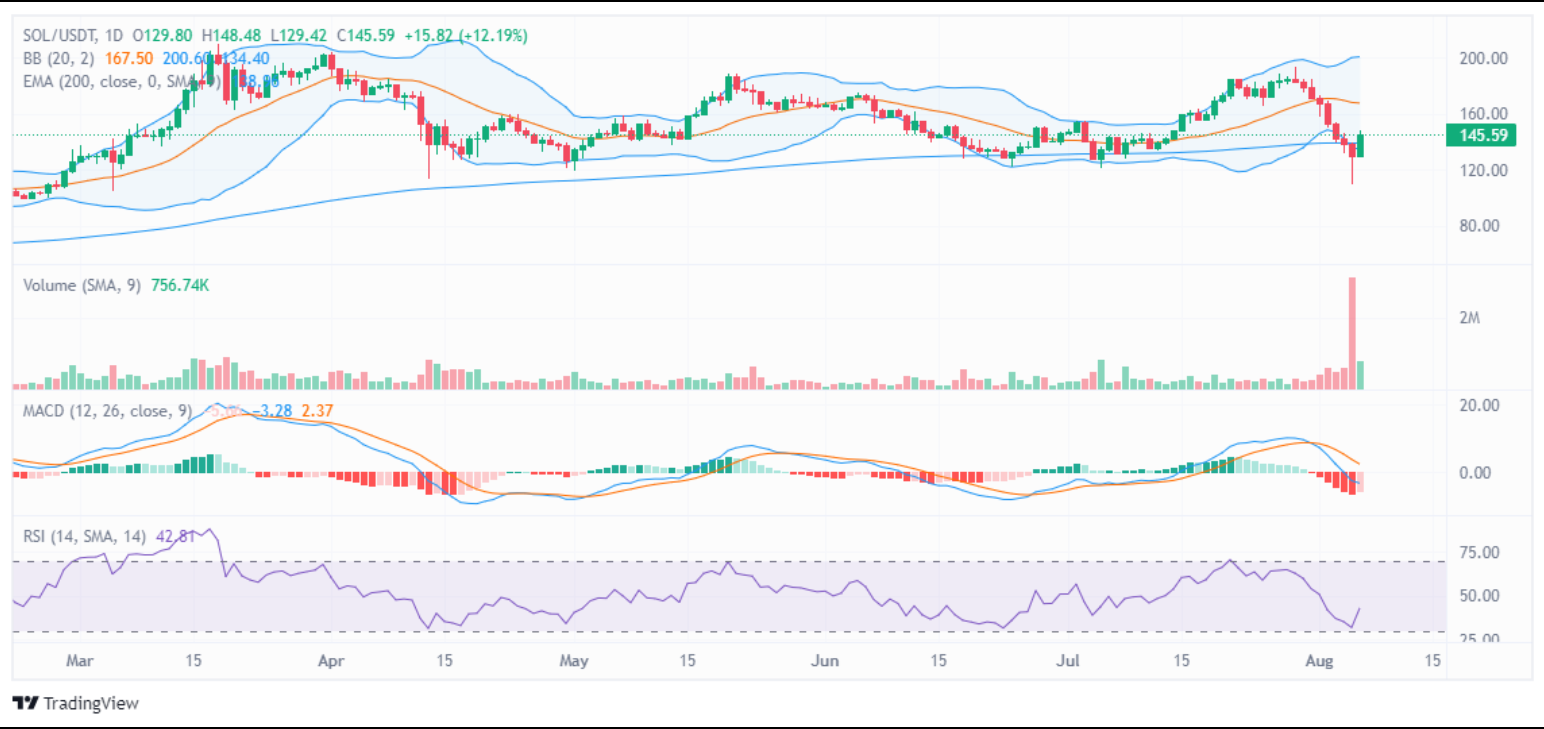
Meanwhile, Solana also showed strong price movements. Yapper noted that SOL’s price bounced from a strong horizontal support level and is valued at $146.86, with a 24-hour trading volume of $6,229,420,774. Solana is up 12.25% in the last 24 hours, with a market cap of $68,390,637,681.
$SOL Bouncing From Support !
— Crypto Yapper (@CryptoYapper) August 6, 2024
This horizontal level is holding strong for now.#Solana needs to seperate itself from this level and show strength. pic.twitter.com/qj08ldbNAI
Technical indicators for SOL also show positive signs with the price being above the 200-day exponential moving average (EMA). Bollinger Bands indicate high volatility, with the price touching both upper and lower bands.

Source: TradingView
Moreover, a volume spike coincided with the recent price drop and bounce. The MACD recently crossed below the signal line, which could be a short-term bearish signal. However, the RSI is at 42.81, recovering from near oversold levels, suggesting potential for further gains.
The Bull-Bear Market Cycle Indicator has flagged BEAR phase (high blue area) for the first time since January 2023.
— Julio Moreno (@jjcmoreno) August 6, 2024
Other periods when it has flagged BEAR phases for a limited period have been the COVID sell-off (March 2020) and the Chinese mining ban (May 2021). It then… pic.twitter.com/hwJRFjJuFg
Meanwhile, Julio Moreno, Head of Research CryptoQuant, reported the Bull-Bear Market Cycle Indicator flagged a bear phase, the first since January 2023. This highlights a notable market shift, impacting overall sentiment.
Disclaimer: The information presented in this article is for informational and educational purposes only. The article does not constitute financial advice or advice of any kind. Coin Edition is not responsible for any losses incurred as a result of the utilization of content, products, or services mentioned. Readers are advised to exercise caution before taking any action related to the company.
 coinedition.com