Dogwifhat (WIF) plunged to a year-to-date (YTD) low of $1.82 on June 25. Its price has since rebounded by 13% to trade at $2.05 at press time.
Some of WIF’s technical indicators suggest a gradual resurgence of bullish sentiment toward the meme coin.
Dogwifhat Bulls Attempt Re-entry
Assessed on a daily chart, the dots of WIF’s Parabolic Stop and Reverse (SAR) indicator currently lie under its price.
This indicator measures an asset’s trend direction or price movements. When its dotted lines are placed below the price, the market is said to be in an uptrend. It indicates that the asset’s price is climbing, and the trend may continue.
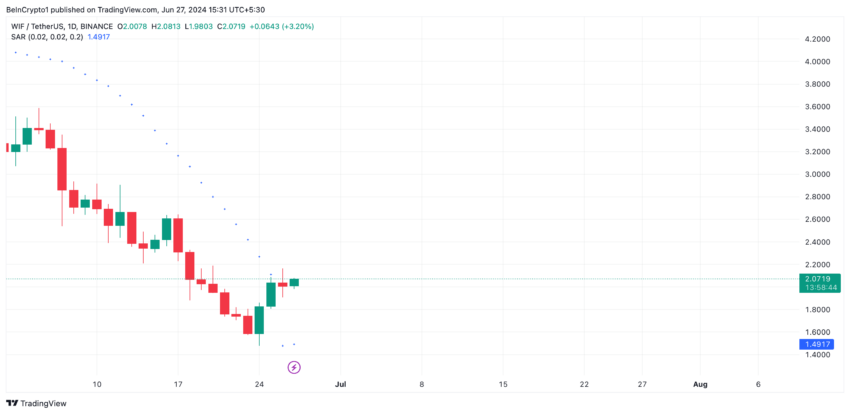
These dots were placed above WIF’s price between June 2 and 24, signaling the decline in the meme coin’s value. However, a flip occurred on June 25, suggesting a shift in market trend from bearish to bullish.
As of this writing, readings from WIF’s Moving average convergence/divergence (MACD) show its MACD line (blue) poised to cross above its signal line (orange).
Read More: How To Buy Dogwifhat (WIF) and Everything Else To Know
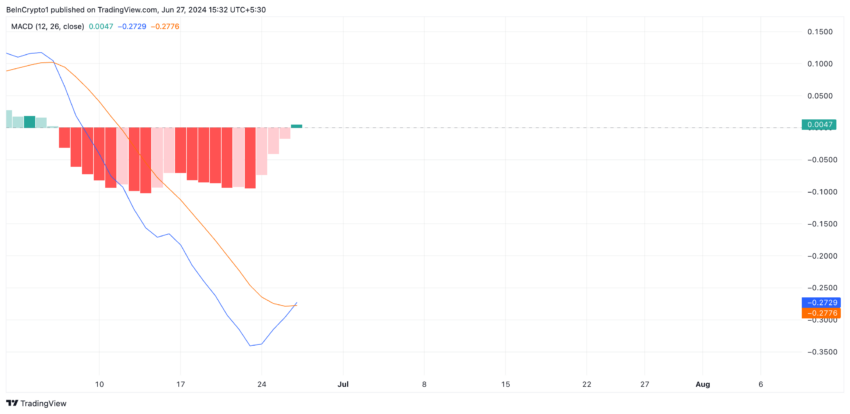
This indicator measures the changes in an asset’s price strength, direction, momentum, and duration. When the MACD line crosses above the signal line, it is a bullish sign. It means the asset’s short-term moving average has rallied past its long-term moving average.
WIF Price Prediction: Price Forms Ascending Channel
WIF’s rally has led to the gradual formation of an ascending channel. This channel is formed when an asset’s price consistently makes higher highs and higher lows over time within a confined price range.
If this trend continues, the meme coin’s value may rally to $2.17.
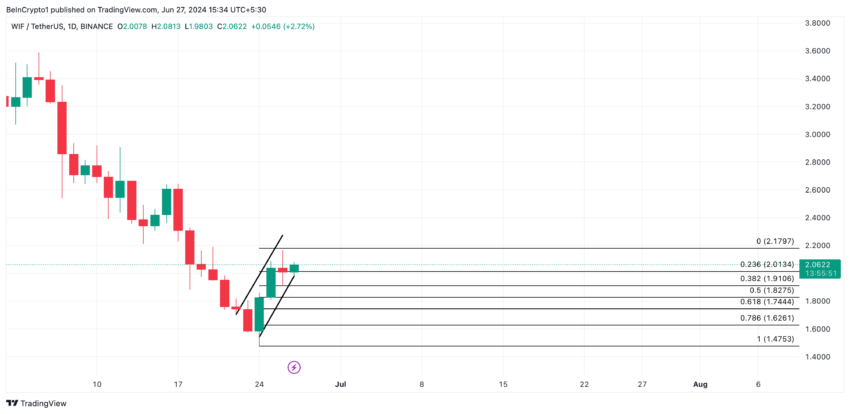
However, if WIF sheds these gains, its price may drop to $1.19.