Frog-themed memecoin BOOK OF MEME (BOME) attempted to remain above $0.01 between June 16 and 17. But it could not, as the price dived by 6.03% in the last 24 hours.
In this analysis, BeInCrypto examines the unsuccessful venture, the reasons behind the decline, and how BOME may perform in the short term.
Bulls Were Quick To Give Up
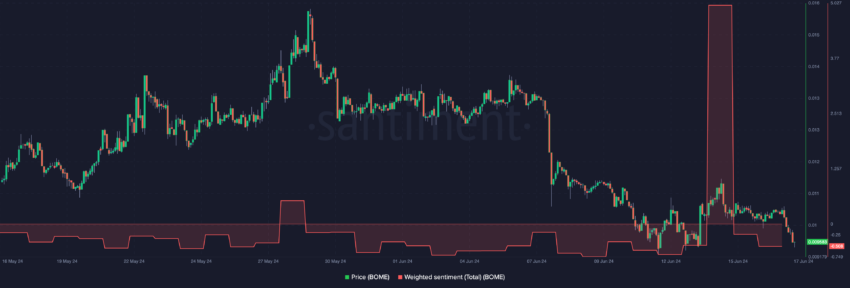
On-chain data reveals that the sentiment around the token was initially bullish before the price fall. According to analytic platform Santiment, the Weighted Sentiment rose to 4.97 on June 15.
Weighted Sentiment measures market participants’ positive or negative comments about a project on social media platforms. Spikes in this metric indicate positive mentions regarding an asset.
Conversely, dips to the negative region imply that the average comment about a cryptocurrency is bearish. An assessment of the metric shows that the bullish sentiment around BOME did not last, as the reading fell to the negative region hours after it skyrocketed.
Read More: BOOK OF MEME (BOME) Price Prediction 2024/2025/2030
At press time, the Weighted Sentiment reading remains -0.50. Typically, rising bullish sentiment may set off demand for a token. However, this may not happen for BOME as a bearish outlook suggests that participants do not believe that the token may offer good returns anytime soon.

Interestingly, BOME’s price is $0.0095, trading in a region similar to the price in our previous report.
Interest in BOME Drops
However, according to indications from the Open Interest (OI), the price may be in line to reach lower levels.
Open Interest refers to the value of outstanding contracts in the derivatives market. When the OI increases, it means that market participants are increasing their net positioning. In this instance, new money enters the market, and speculative activity rises.
On the other hand, a decline in OI implies that traders are exiting their positions and removing liquidity from the market.
According to Coinglass, BOME’s Open Interest is $79.98 million, a decrease from 24 hours ago. This decrease means that traders are aggressively closing their BOME contracts.

From a trading point of view, the decrease in Open Interest suggests that the memecoin may be unable to create any impulsive price move. Instead, the next thing for the price could be a dump into the underlying support zone.
BOME Price Prediction: Can It Evade $0.0093?
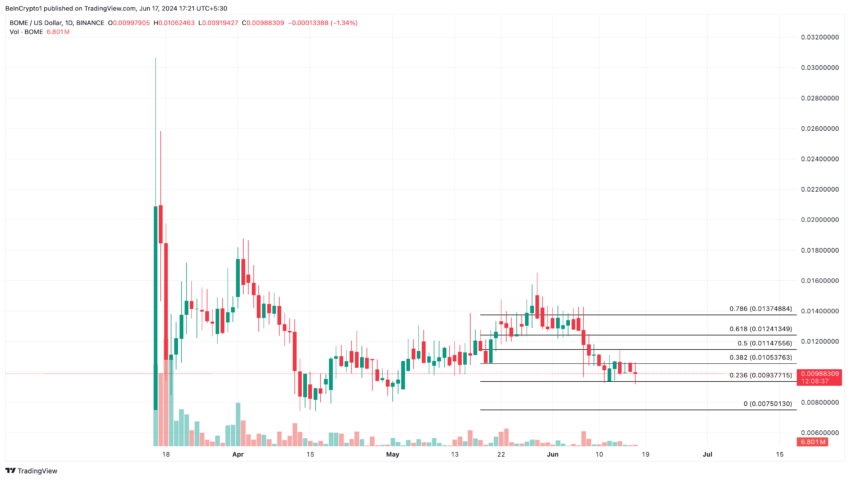
The Fibonacci Retracement indicator provides good insight into the support and resistance zones. Specifically, the highest important retracement levels are the 23.6%, 38.2%, 50%, 61.8%, and 78.6% horizontal lines.
On the daily BOME/USD chart, the 23.6% Fibonacci retracement positions at $0.0093. Thus, BOME’s price may experience a nominal pullback to this level in the short term.

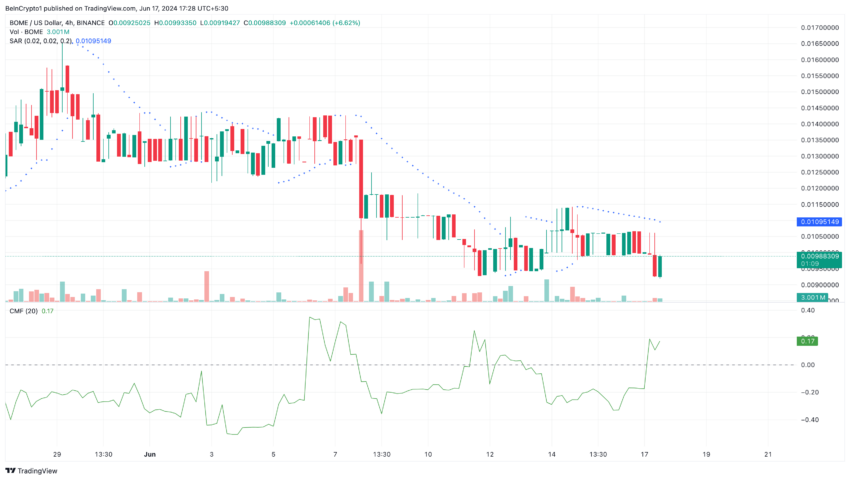
Furthermore, the Parabolic Stop And Reversal (SAR) aligns with the bearish prediction. The Parabolic SAR indicates potential price reversals and can be crucial to identifying entry and exit points.
If the Parabolic SAR dots below the candles, it means that a cryptocurrency has flashed a buy signal. But as of this writing, the dots were above BOME’s candles, suggesting that it may be time to sell the token before another decrease.
Read More: How to Buy BOOK OF MEME (BOME) and Everything Else To Know
However, the Chaikin Money Flow (CMF) shows signs of invalidation. The CMF measures buying and selling pressure over a period of time. It also uses the flow of liquidity to measure if an asset is overbought or oversold.

At press time, the CMF positions at 0.17. This means that traders are buying the BOME dip. Should this accumulation continue, BOME’s price may bounce, and a target of $0.011 may be plausible.
 beincrypto.com
