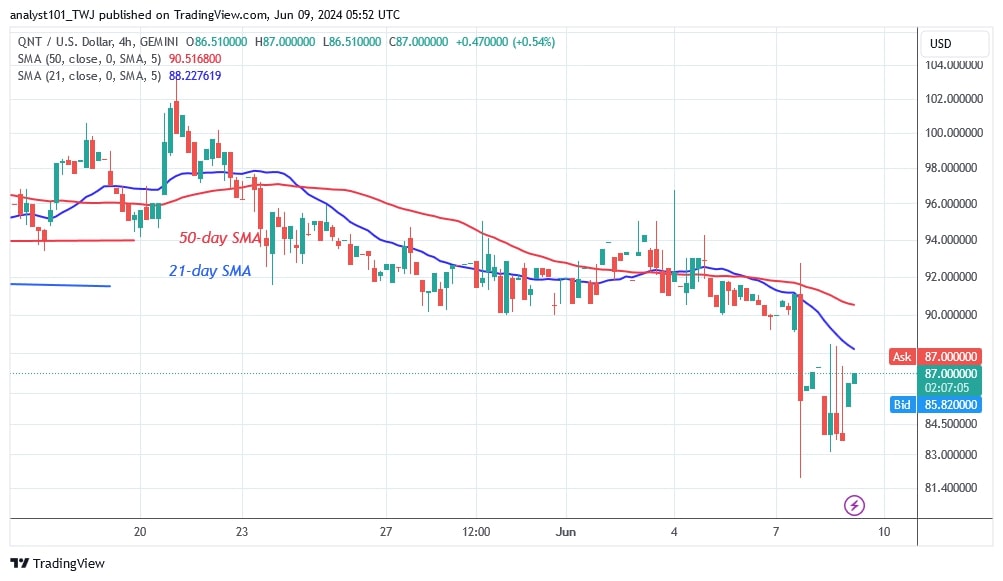
The price of Quant (QNT) has fallen further and is approaching the expected low of $76.96.
Long-term Quant price prediction: bearish
On June 7, the bearish momentum broke through the previous low of $85 and reached $81 before retracing. The price of the cryptocurrency is correcting upwards to retest the $85 barrier.
Should the bulls break the $85 barrier, the recent slide could reverse. According to price analysis by Coinidol.com, QNT will trade in a range between the $85 support level and below the moving average lines. However, if it is rejected at the $85 high, selling pressure will return. On the downside, the altcoin will fall but then reverse at the 1.272 Fibonacci extension or at $76.96.
Analysis of the quant price indicator
After the recent dip, the QNT price bars have fallen even further below the moving average lines. Since April 14, the moving average lines have shown a bearish crossover, which occurs when the 21-day SMA crosses below the 50-day SMA. This indicates a bearish signal.
Technical Indicators
Important supply zones: $140, $150, $160
Important demand zones: $90, $80, $70

What is Quant's next move?
Quant has fallen below the moving average lines on the 4-hour chart. On June 7, the altcoin plunged to a low of $81 as bulls bought the dips. The price of the cryptocurrency is oscillating between support at $81 and resistance at $85 or the 21-day moving average line. QNT's price is falling as it encounters rejection at the moving averages.

Disclaimer. This analysis and forecast are the personal opinions of the author and are not a recommendation to buy or sell cryptocurrency and should not be viewed as an endorsement by CoinIdol.com. Readers should do their research before investing in funds.
 coinidol.com
