- Avalanche price analysis is bullish today.
- The nearest resistance is found at $119.
- The support for AVAX is found at $110.
The Avalanche price analysis is bullish for today as the coin has broken past the $116 crucial resistance. The cryptocurrency started the recent bulls run on 14th December following a period of decline for three weeks, after hitting an all-time high on 13th December. Today bulls rallied high from $113 to $117, breaking past the resistance at $116 as the bullish momentum is quite overwhelming today.
AVAX/USD 1-day price chart: AVAX bulls to conquer $119 bears camp
The 1day price chart for Avalanche price analysis shows the coin price has reached $117 as it is trading hands at exactly $117.22 at the time of writing. The crypto pair reports an increase in price value amounting to 13 percent over the last 24 hours, and the cryptocurrency also reports a handsome profit in terms of price gain amounting to 50.2 percent over the past week as the price function remained upwards and the coin continues to get quite a positive sentiment form the market. The market cap also increased by 11.38 percent overnight, and the trading volume has increased by 95 percent for the same time period.
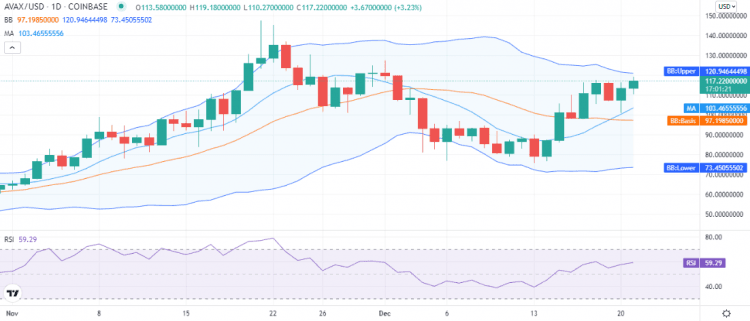
The Bollinger bands show high volatility, with the upper band at $120 representing resistance for AVAX to encounter, and the lower band is at the $73 mark, making an average at $97 representing the support level. The moving average (MA) is at the $103 mark below the price level. The relative strength index (RSI) is at a score of 59 on an upwards slope indicating the buying activity in the market as the market continues to show support for AVAX.
Avalanche price analysis: Recent developments and further technical indications
The 4-hour Avalanche price analysis shows the coin is nearing the overbought status as the buying activity continues in the market. The price function is upwards for the last 16 hours, following a good amount of retracement for 40 hours continuously when bears intervened. But bulls gained momentum again, and the price has been moving upwards again since the second half of the last trading session and has recovered the entire corrected value as the price is now $117.
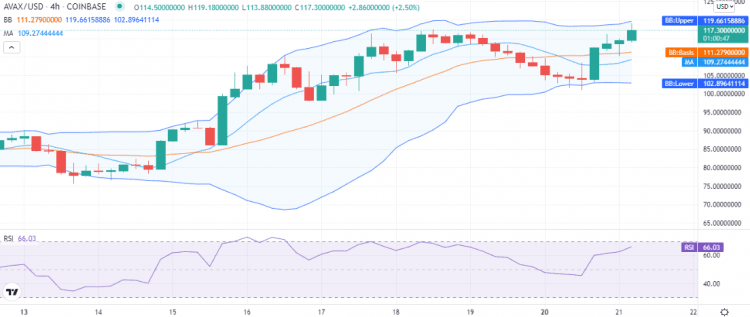
The volatility is comparatively high for AVAX on the 4-hour chart, as the Bollinger bands are expanded. The upper band is at the $119 mark representing resistance, and the lower band is at the $102 mark. The average of Bollinger bands is at $111, representing support for the coin. The moving average (MA) is at the $109 mark. The relative strength index (RSI) is trading near the overbought region but still in the neutral region at index 66, and the RSI curve is still upwards, hinting at continued buying activity in the market.
Avalanche price analysis: Conclusion
The Avalanche price analysis shows the coin is bullish, and we expect it to continue upside above $119 resistance even above the $121 resistance level. However, a small period of retracement is also expected in between.
Disclaimer. The information provided is not trading advice. Cryptopolitan.com holds no liability for any investments made based on the information provided on this page. We strongly recommend independent research and/or consultation with a qualified professional before making any investment decisions.