The price of Polygon (MATIC) is moving sideways as it recovers from its recent decline. Price analysis by Coinidol.com.
Long-term forecast for the Polygon price: declining
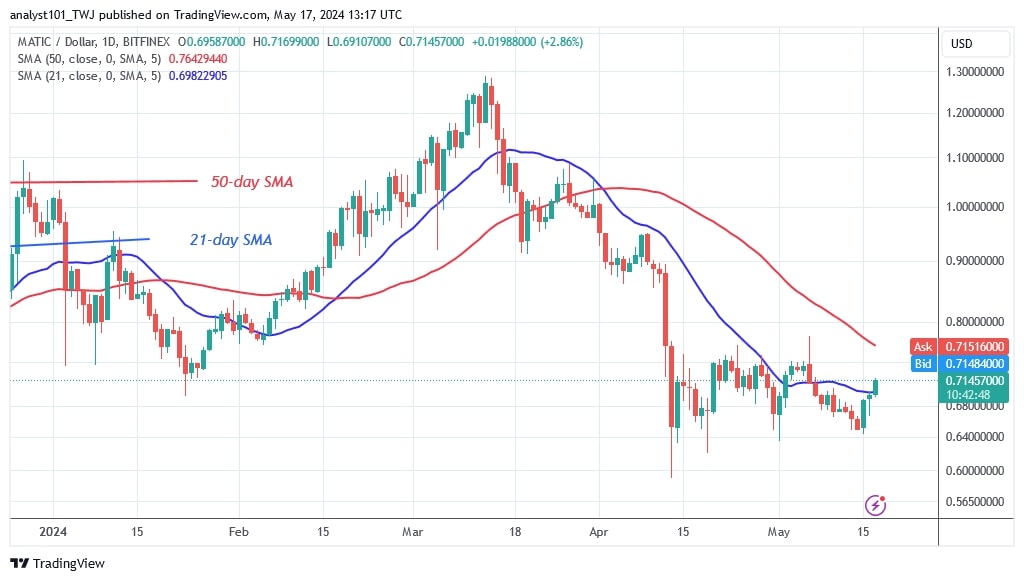
Currently, MATIC is trading above the 21-day SMA but below the 50-day SMA. Moreover, the altcoin is trading above the $0.63 support and below the $0.75 resistance. Polygon is forecast to rise above the 50-day SMA. However, the uptrend is encountering resistance near the high of $0.75. During the initial rally, the bulls broke through the 21-day SMA but were stopped at the $0.75 resistance. A break above this resistance would push MATIC above the 50-day SMA.
This will result in the altcoin resuming its uptrend. MATIC will reach its previous highs of $0.95 and $1.00. Nonetheless, the current price will hold unless the bulls manage to break through the resistance at $0.75.
Analysis of the Polygon indicator
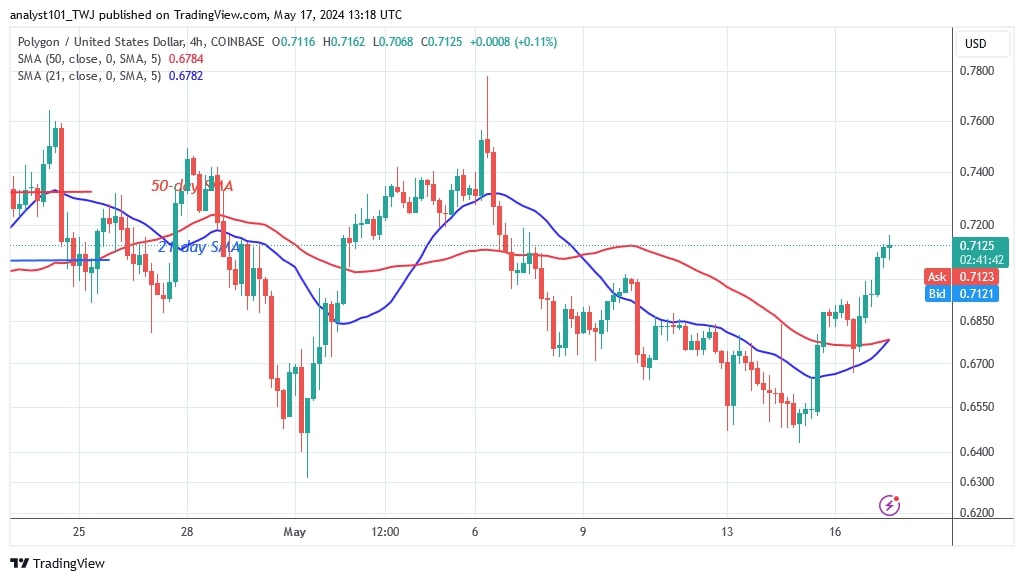
After the recent breakout, the price of the cryptocurrency is now above the 21-day SMA. The altcoin will oscillate between the moving average lines. The current uptrend is halted by the resistance at $0.75. On the 4-hour chart, MATIC price bars are above the moving average lines, indicating that prices are currently rising.
Technical Indicators
Resistance levels: $1.20, $1.30, $1.40
Support levels: $0.60, $0.40, $0.30

What is Polygon's next move?
Polygon is trading in a range between the moving average lines. If the resistance of $0.75 is broken and the bullish momentum remains above the recent high, the altcoin will continue to trend higher. Currently, the uptrend has stalled at the high of $0.71.

Disclaimer. This analysis and forecast are the personal opinions of the author and are not a recommendation to buy or sell cryptocurrency and should not be viewed as an endorsement by CoinIdol.com. Readers should do their research before investing in funds.
 coinidol.com