Bears are dominant in today’s session, as evidenced by the fall in the global market cap. The total cap stood at $2.2T as of press time, representing 6%, while the trading volume stood at $91.01B, representing a 37.71% increase over the last 24 hours.
Bitcoin Price Review
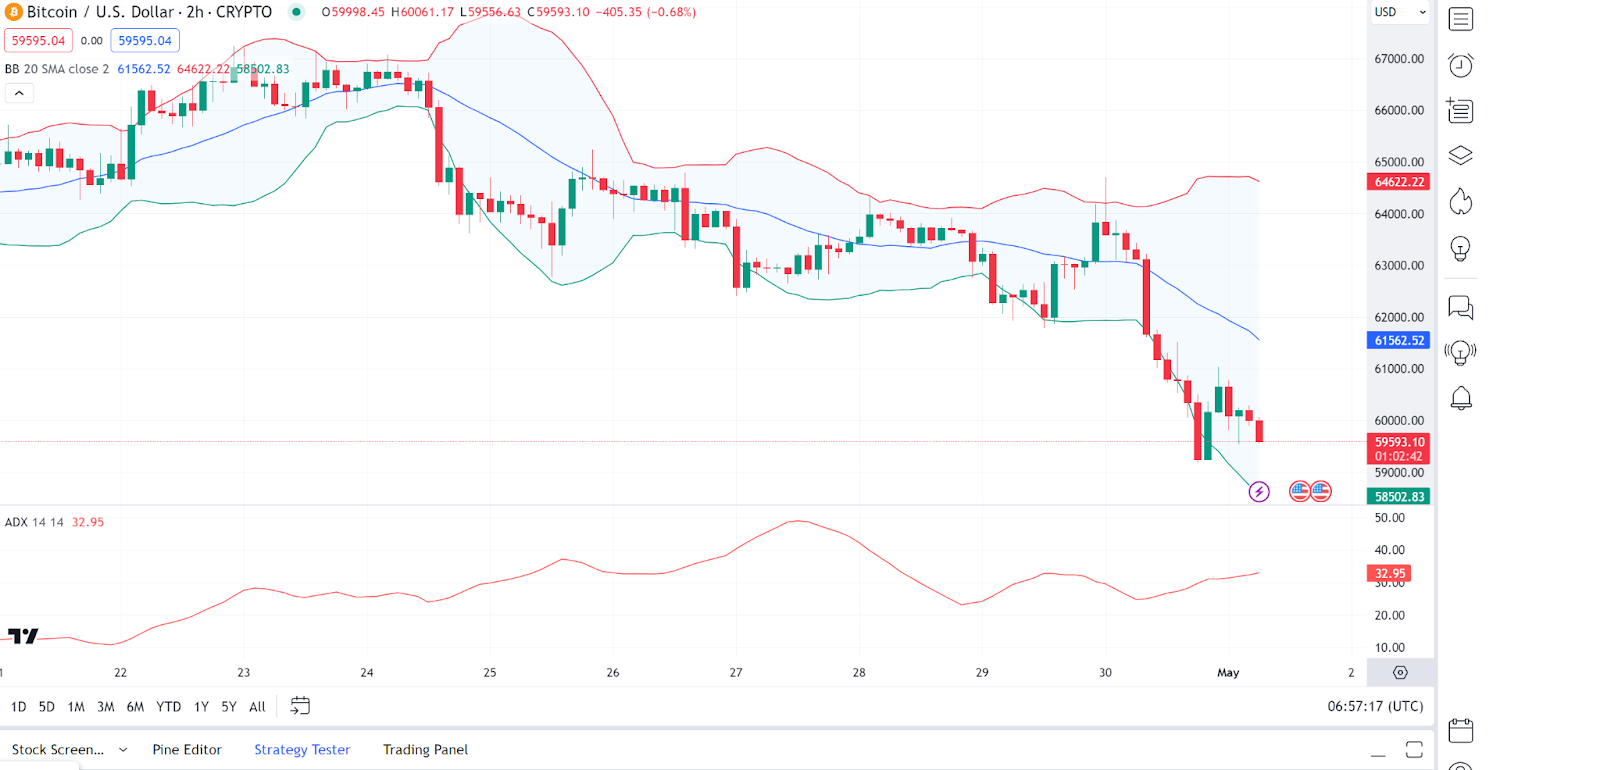
Bitcoin ($BTC) has fallen prey to the bear wave, as evidenced by its price movements. An in-depth analysis shows that Bitcoin’s price charts show a strong downtrend. $BTC consistently trades below the middle Bollinger band and recently broke below the lower Bollinger band, indicating high volatility and bearish momentum.
On the other hand, the ADX value is above 25, suggesting a strong prevailing trend. The recent bearish candle indicates that the downward momentum may continue. As of press time, the Bitcoin price stood at $58,520, representing a 7.7% drop from its previous 24-hour price.
Ethereum Price Review
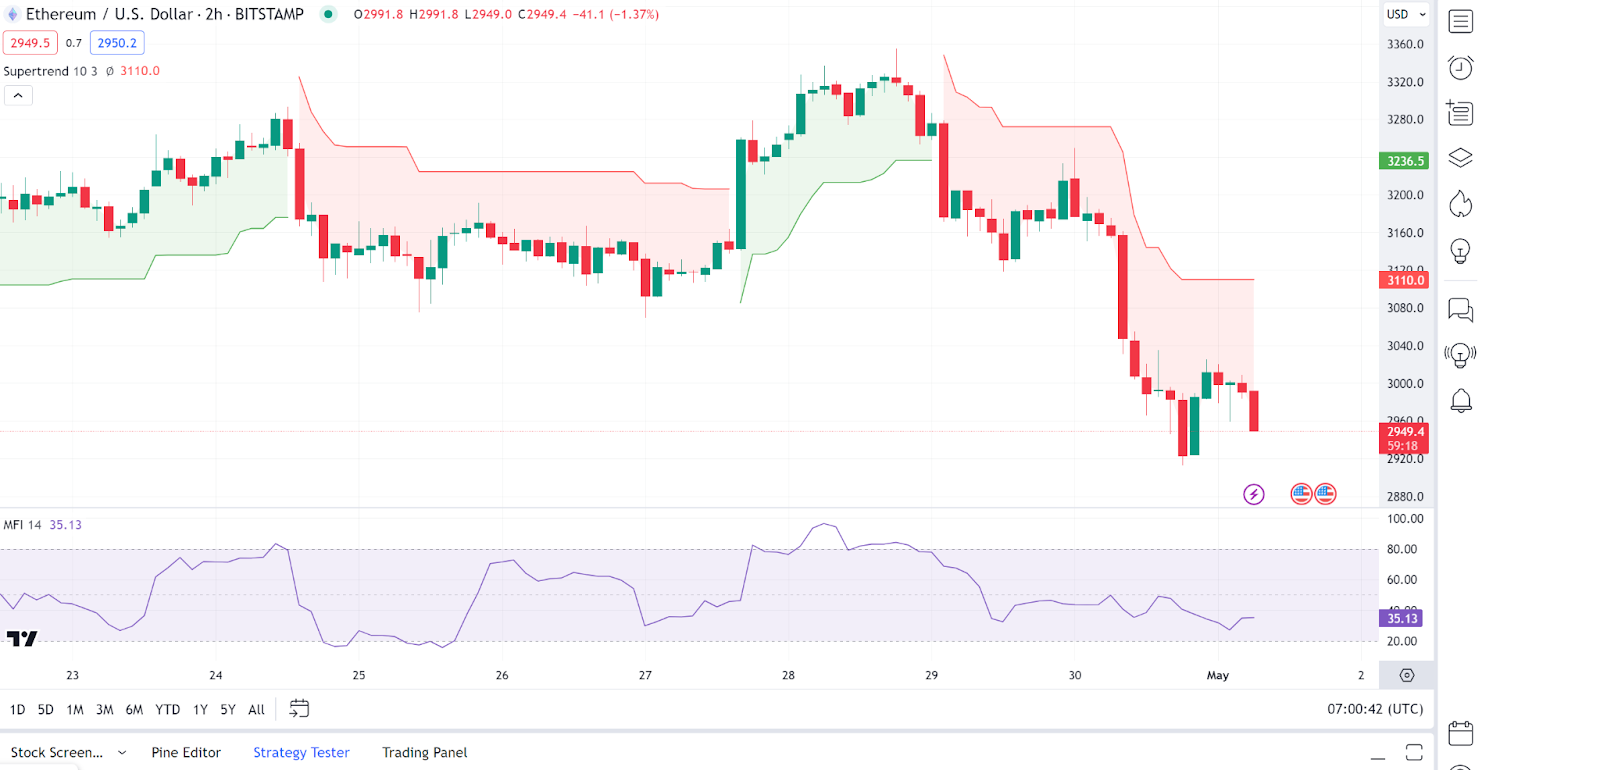
Ethereum ($ETH) has fallen prey to bear activity and posted a notable drop in its valuation. Analysing Ethereum price charts, we see that Ethereum is also in a downtrend, evidenced by its position below the central moving average of the Bollinger Bands.
On the other hand, the Money Flow Index (MFI) indicator is around 35, indicating that the market is not yet in oversold territory. As of press time, the Ethereum price stood at $2,907, representing an 8.39% drop from its previous 24-hour price.
Cosmos Price Review
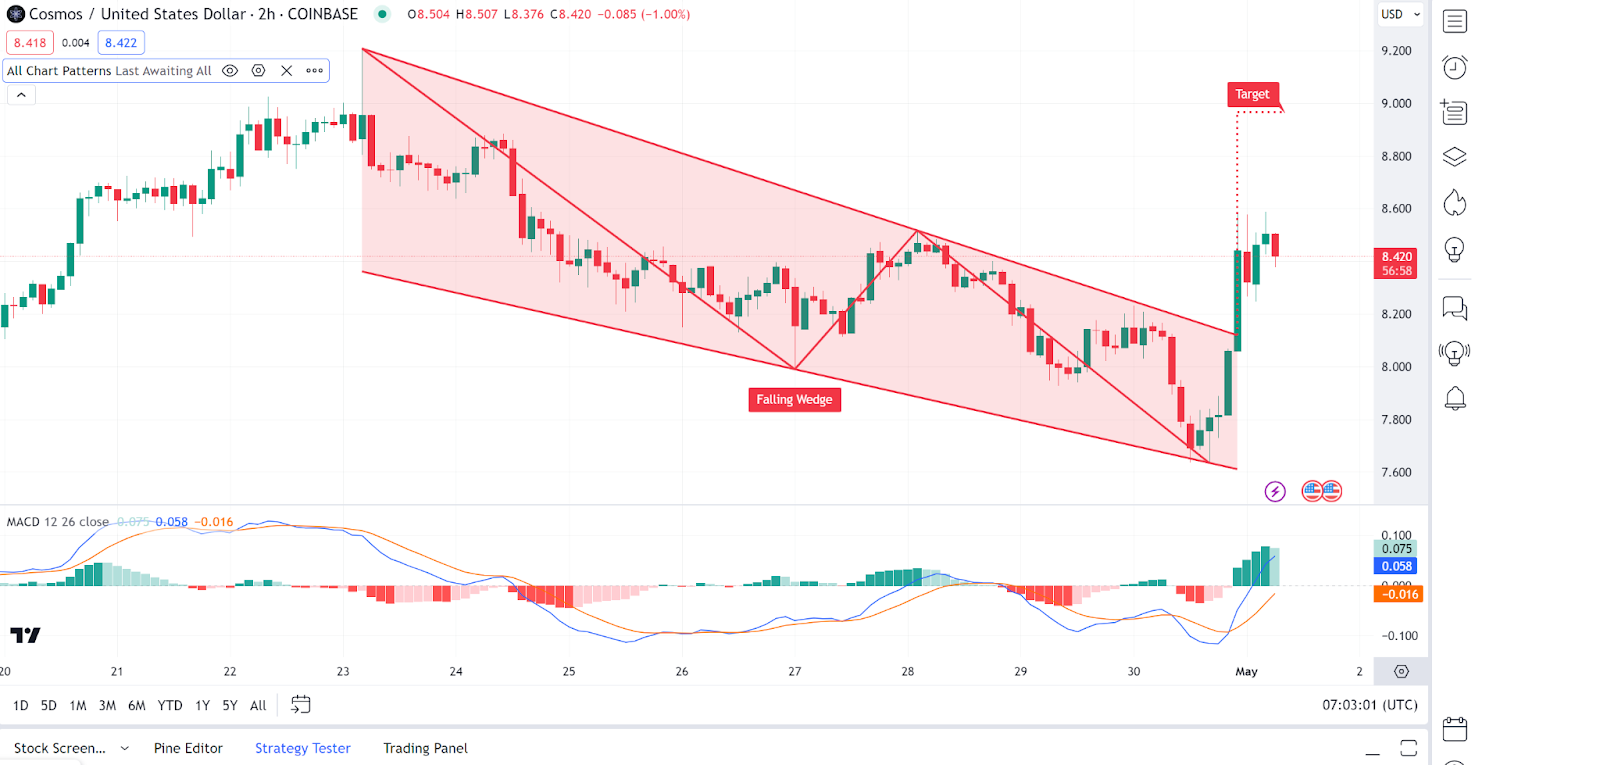
However, Cosmod ($ATOM) has defied the odds to post gains in today’s session, as evidenced by its price movements. An in-depth analysis shows that Cosmos shows a potential falling wedge pattern, typically a bullish reversal pattern.
The Cosmos price is starting to break out of the wedge, which could indicate the start of a bullish reversal. The Cosmos price stood at $8.33 as of press time, representing a 2.3% increase from its previous 24-hour price.
Cronos Price Review
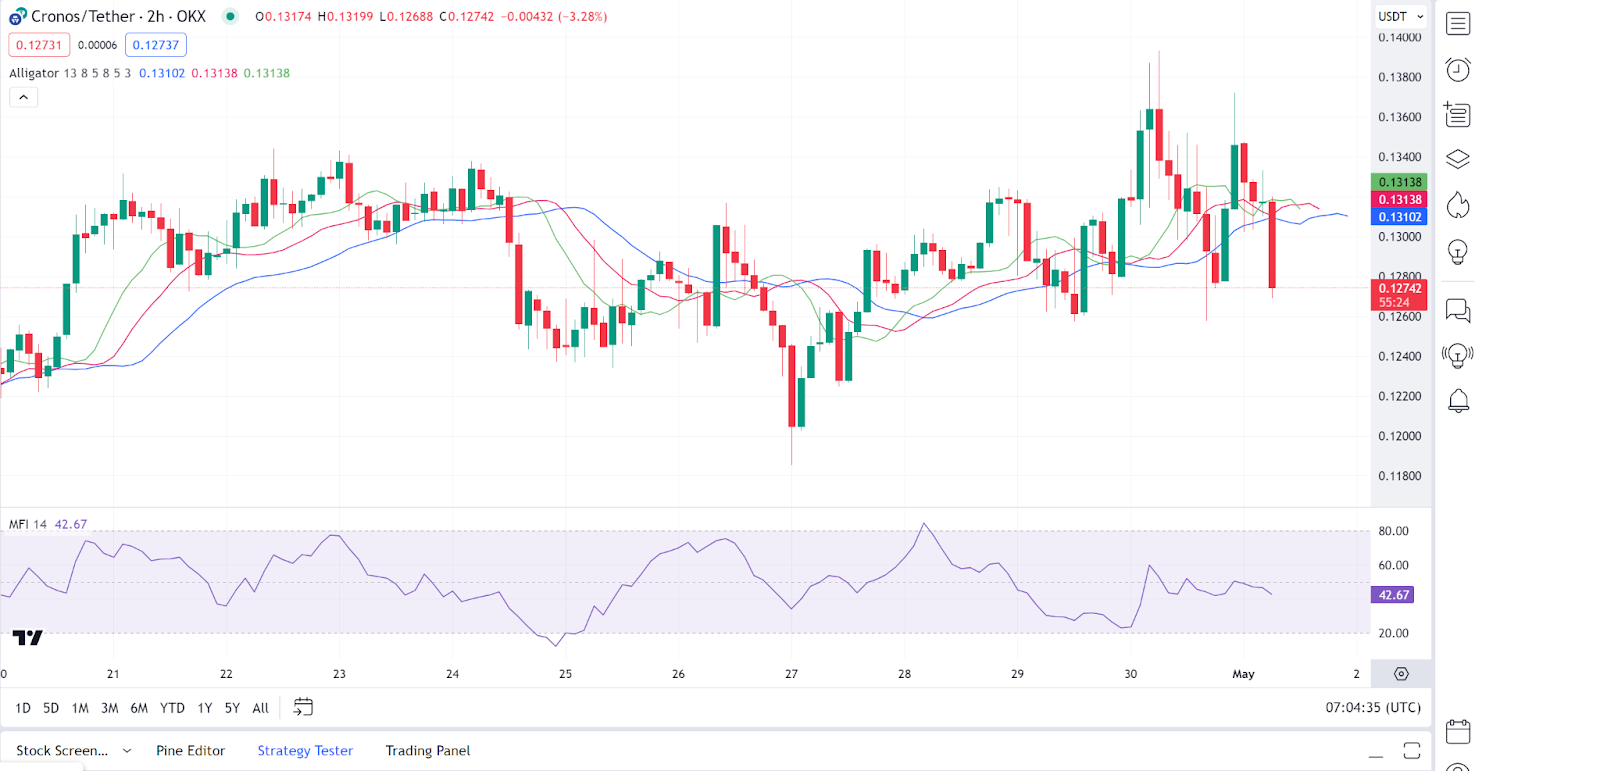
Cronos ($CRO) is now facing corrections amid the bear wave that is being felt today. An in-depth analysis shows that the Cronos price action is choppy and mostly trading sideways as the Alligator indicator’s lines are intertwined, suggesting a lack of clear market direction.
On the other hand, looking at other indicators, we see the Money Flow Index (MFI) is trending around 42, which does not provide a strong indication of overbought or oversold conditions. The Cronos price stood at $0.215 as of press time, representing a 6.5% increase from its previous 24-hour price.
Ripple Price Review
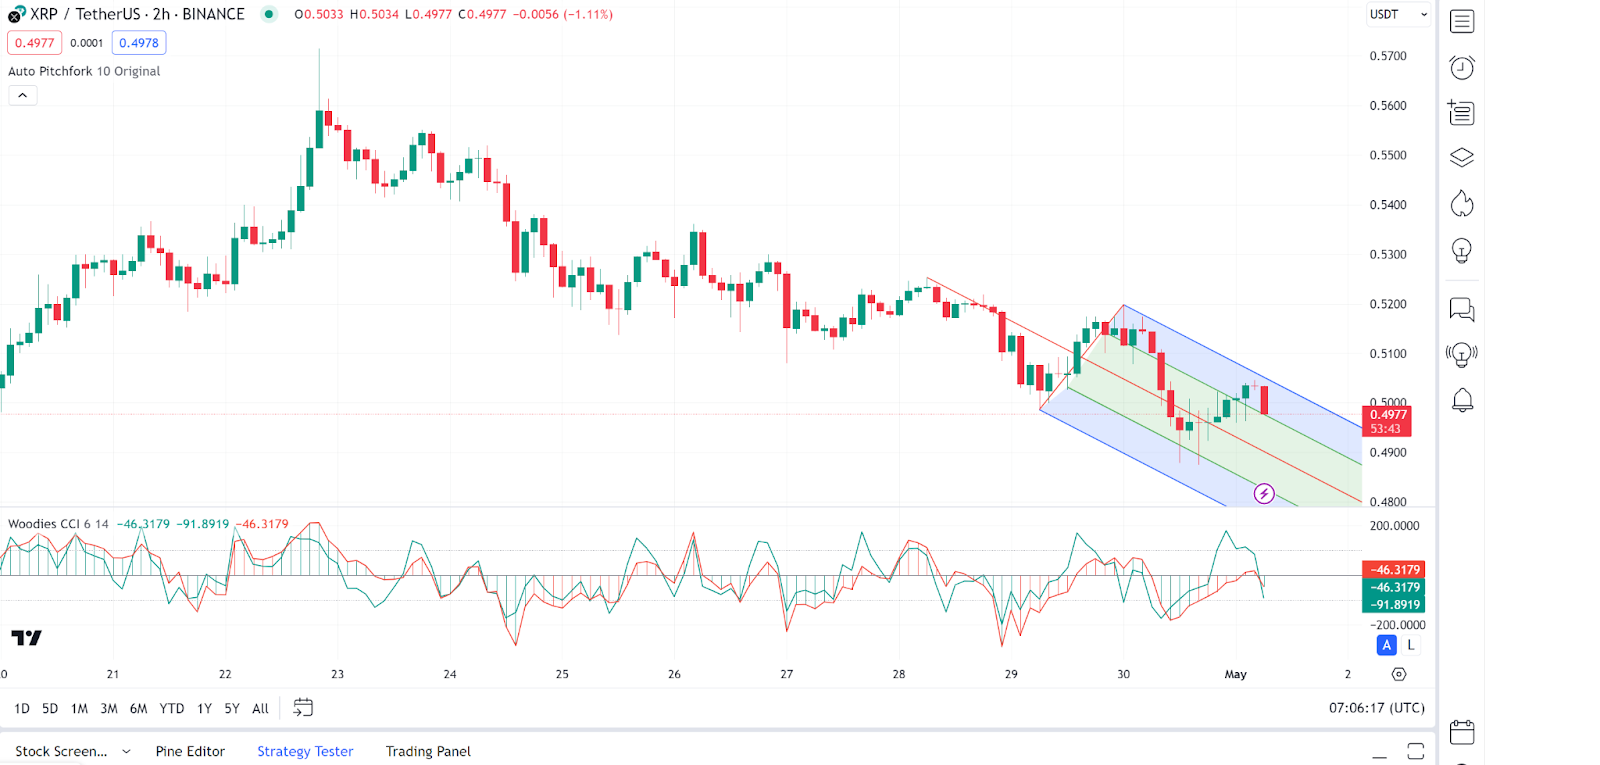
Ripple ($XRP) has also been hit with the bear wave, as seen from its price movements during today’s session. Looking at an in-depth analysis, we see that $XRP shows a downward channel within the pitchfork. The Woodies CCI is oscillating around the zero line, indicating a lack of strong momentum.
The channel’s consistent lower highs and lower lows suggest a bearish sentiment. Traders should be cautious of a further decline if the lower boundary of the pitchfork is breached. As of press time, the Ripple price stood at $0.4916, representing a 4.2% increase from its previous 24-hour price.