
- On the daily technical chart, $WLD
$WLD ~USD" api="cryptocompare.com" realtime="true" animation="backgroundRedGreen"> coin managed to stay above the $4.08 – $4.34 support range, maintaining its positive trend structure. - For long-term spot traders, spot trades may be considered if $WLD falls to the $4.79 support.
- Daily closes above the $6.03 resistance mentioned in the analysis indicate a positive reversal in the $WLD price, with a target of $9.47.
$WLD coin’s daily technical analysis provides direction for long-term traders by indicating support and resistance levels.
MEDIUM TERM $WLD ANALYSIS
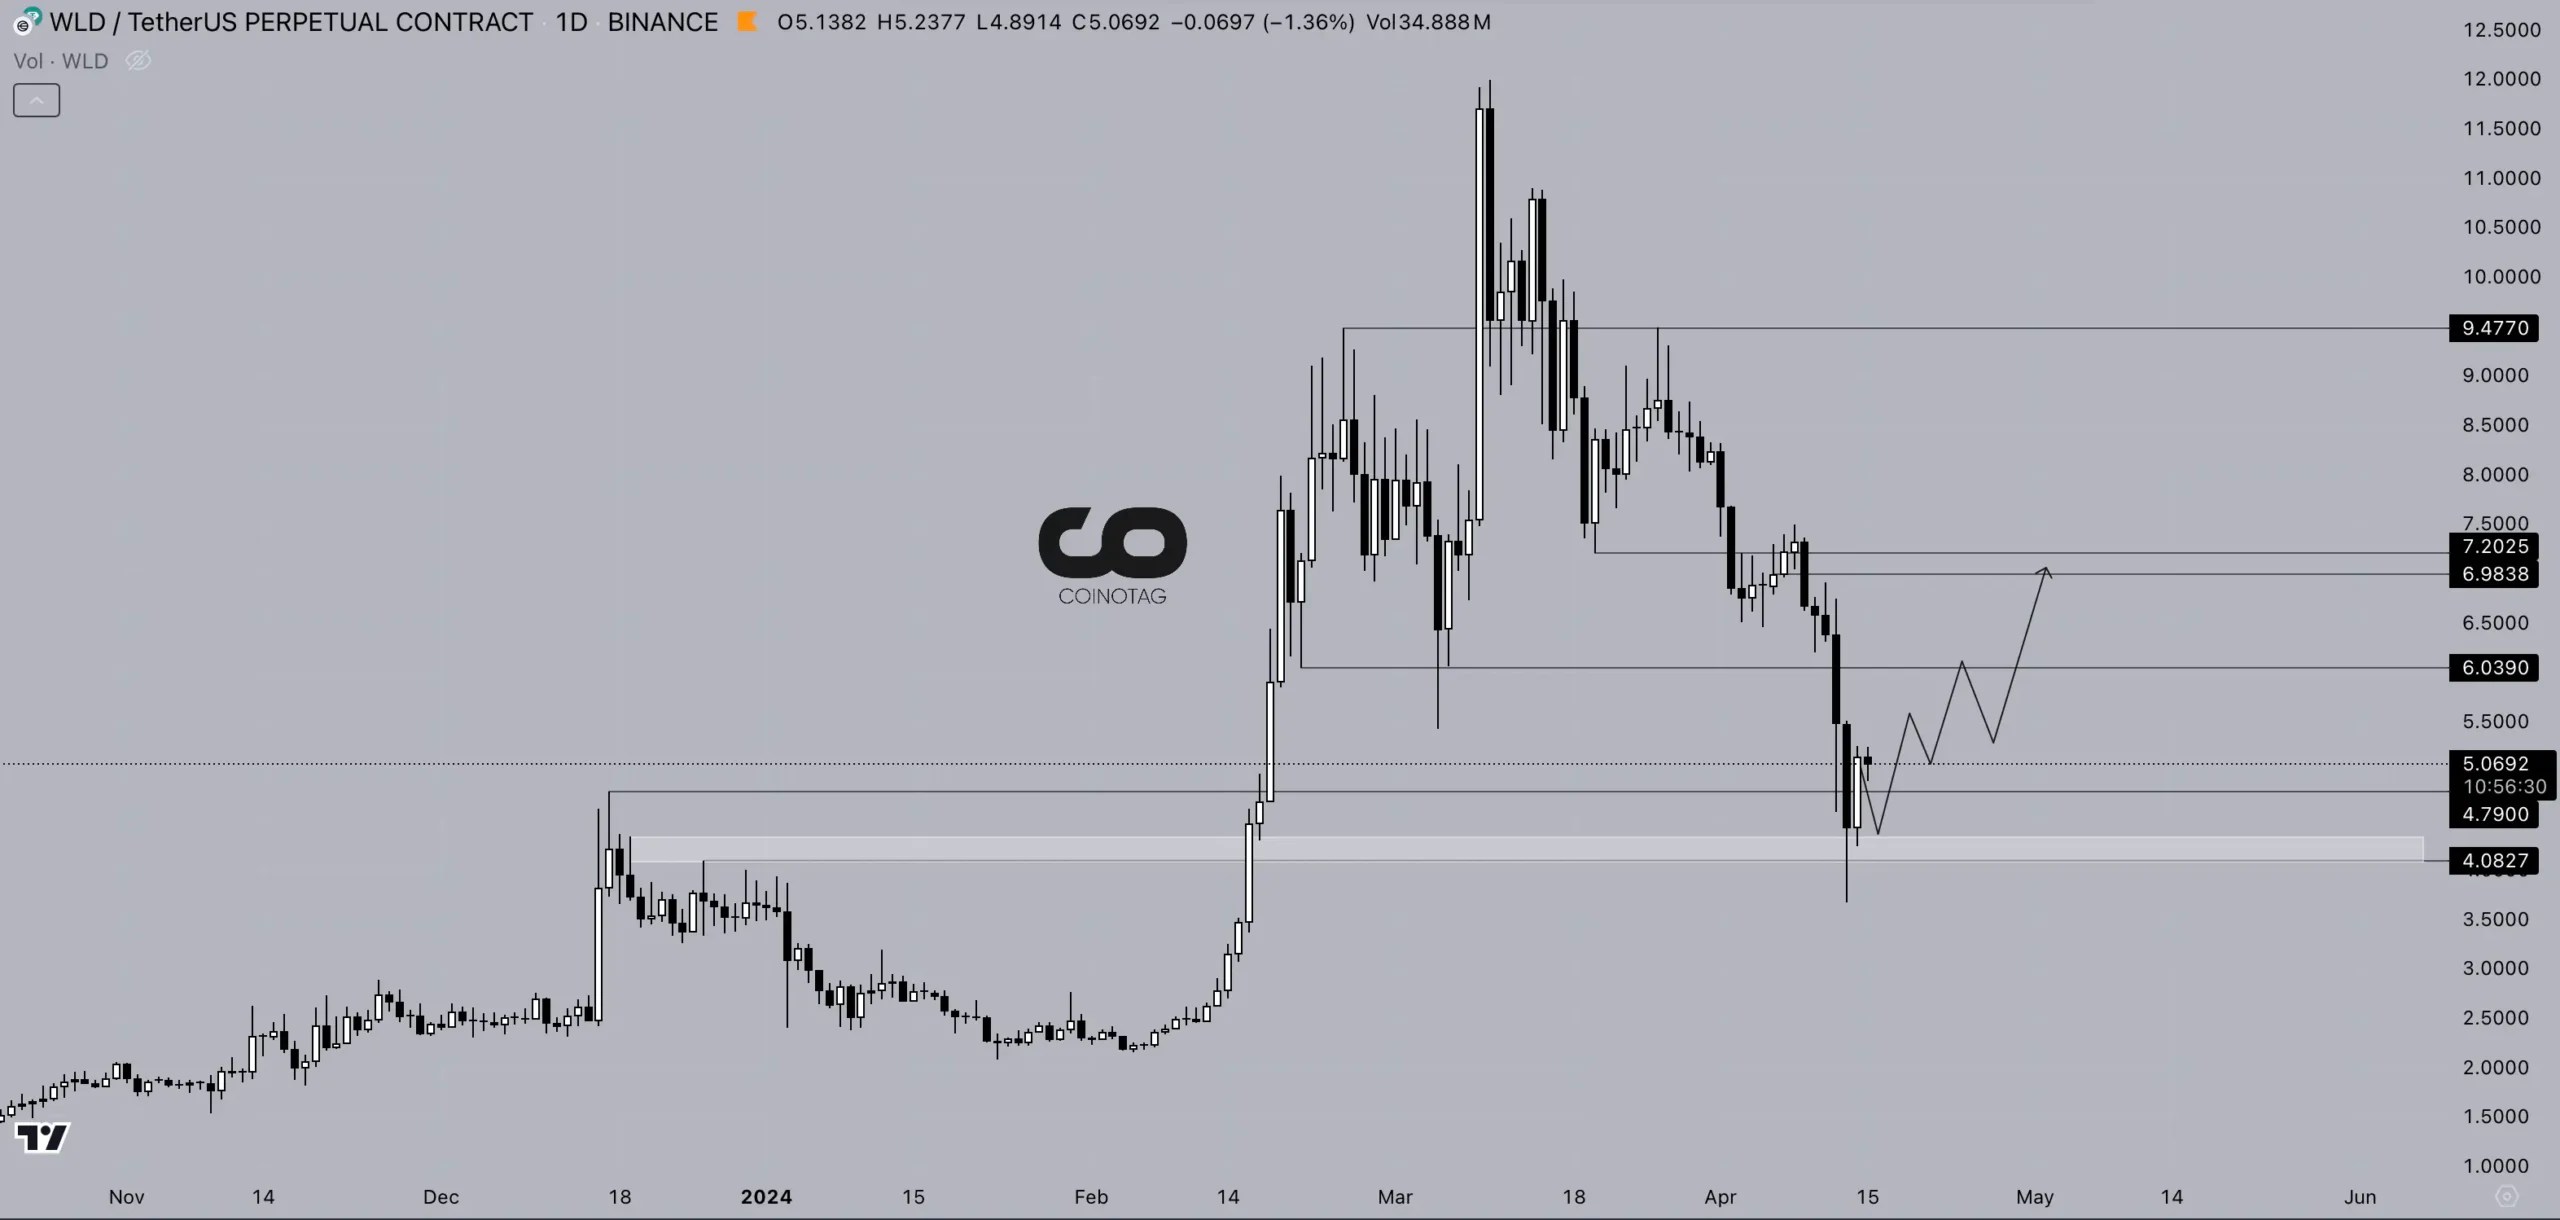
When we examine the daily technical chart of the $WLD coin, it has managed to stay above the $4.08 – $4.34 support range, keeping the trend structure positive. As long as the $WLD coin stays above the $4.08 – $4.34 support range, it will continue its rise up to $6.03.
Considering long-term spot investments for $WLD coin, spot investments can be considered if the $WLD price drops to $4.79 support. As long as $WLD coin closes weekly candles above the $4.08 – $4.34 support zone, they can maintain $WLD spot investments.
If $WLD coin closes daily candles above the $6.03 resistance in the analysis, it will signal that we are back to a positive structure in the $WLD price. As long as $WLD coin stays above the $6.03 level, its target will be $9.47.