XRP was created by Ripple to be a speedy, less costly, and more scalable alternative to both other digital assets and existing monetary payment platforms like SWIFT.
RippleNet’s ledger is maintained by the global XRP Community, with Ripple the company as an active member. The XRP Ledger processes transactions roughly every 3-5 seconds, or whenever independent validator nodes come to a consensus on both the order and validity of XRP transactions — as opposed to proof-of-work mining like Bitcoin (BTC). Anyone can be a Ripple validator, and the list is currently made up of Ripple along with universities, financial institutions, and others.
Let us see the technical analysis of XRP.
Past Performance of XRP
The current XRP price is $0.8461 with a total trading volume of $4,633,757,395.48, which is up by 50% during the last 24 hours. The current ranking is #8, with a live market cap of $40,410,167,357.91. It has a circulating supply of 47,247,295,769 XRP coins. The highest closing price during the last 52 weeks has been $1.96 and the current prices are down by 57% from it.
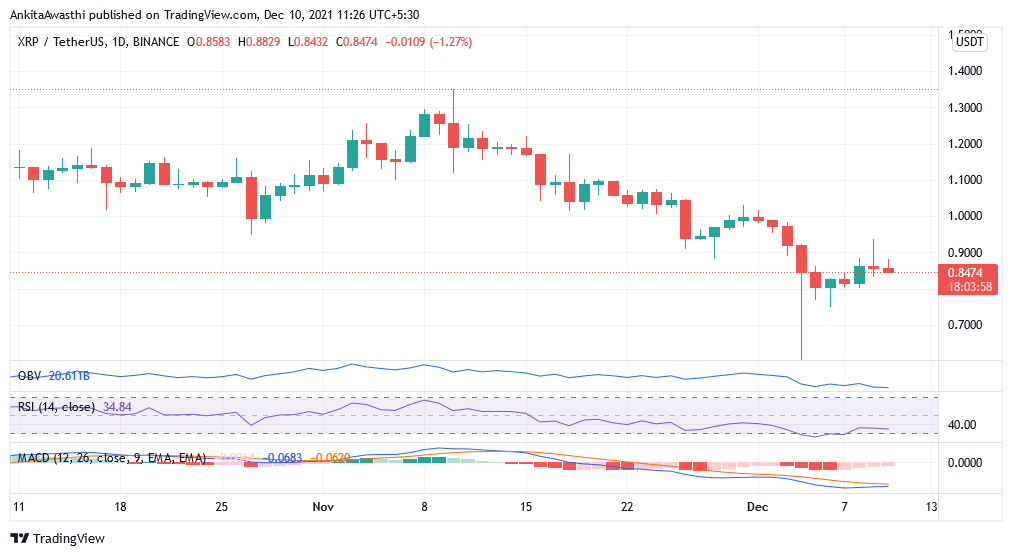
Source: https://www.tradingview.com/x/UXFRjPz9/
XRP Technical Analysis
Executive Chairman and Co-founder of Ripple Chris Larsen has unveiled his plan for Bitcoin miners to move away from Proof of Work (PoW), saying they should view it as “a net positive for their longevity.”
The On-balance Volume is at 20.6 billion, moving from flat to downward direction subtly. The market volumes are not high, though the regular interest of volumes is maintained.
RSI is in the oversold region near 35%, showing an absolute fall in interest. The price does not have a strong incentive to move. Currently, the price is undervalued and there will be a higher chance of moving upwards.
The MACD can be seen with the fast and slow line falling in a converging manner with no real uptick of volumes. The slow line is above the fast line, which indicates the fall is now being incorporated in the trend and there is no chance of a change as of now. Bearishness to continue.
Price Trends for the Day-Ahead and Tomorrow
The current market trend is bearish. The last Doji Star indicator for a trend change was on November 30 and was quoted at a price of $1.00. This indicator could be interpreted as an upwards trend change. The last high in XRP was under the resistance of $2.11 and could not be broken through. The support levels are at $0.930 and then $0.881.