- Binance Coin price analysis suggests
- The closest support level lies at
- BNB faces resistance at the $ mark.
The Binance Coin price analysis shows that after climbing to the $600 mark, the trend was rejected and the price crashed to the $570 mark. While BNB has recovered since then, the price action still faces resistance at the $600 mark.
The broader cryptocurrency market has observed a bearish market sentiment over the last 24-hours as most major cryptocurrencies record negative movements. Major players include SOL and DOT recording a 6.92 and a 6.70 percent decline, respectively.
Binance Coin price analysis: Buyers fight back as price recovers to $580
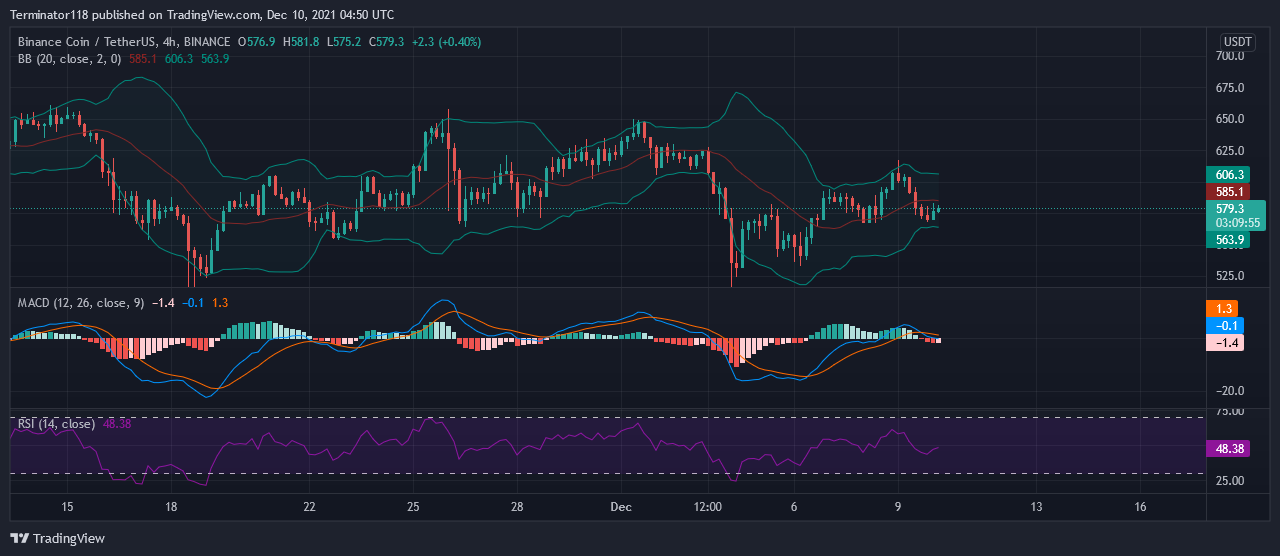
Across the technical indicators, the MACD is currently bearish as expressed in the red color of the histogram. However, the indicator’s light color showed a declining bearish momentum as BNB recovered towards the $585.00 mark. Currently, the indicator shows low bearish momentum that may move to a bullish turnover as the price challenges at the $585 resistance level.
The EMAs are currently trading close to the mean level as the price action observes little net movement across the last 20 days. At press time, the 26-EMA is trading horizontally showing that the mid-term charts observe a high degree of stability as the price oscillates across the short-term charts. Meanwhile, the 12-EMA was moving downwards with a sharp gradient but now shows a change of slope as the bulls successfully defend the $570 support level.
The RSI is moving close to the neutral region and trades close to the 50.00 mean level. At press time the indicator moves horizontally at 48.38 index units showing low momentum across the short-term charts. Furthermore, the low slope shows that the bulls are not dominating the markets as a bearish pressure still weighs on the price action.
The Bollinger Bands are currently narrow as the price action observes low volatility across the mid-term charts. The oscillatory motion makes it unlikely for a breakout in either direction causing the bands to converge. At press time, the bands provide support to the buyers at $563.9 while the bands’ mean line presents a resistance to the bulls at the $585.1 mark.
Technical analysis for BNB/USDT
Overall, the 4-hour Binance Coin price analysis issues a strong sell signal with 14 of the 26 major technical indicators showing support to the bears. On the other hand, only four of the indicators support the bulls suggesting that there is no significant buying activity occurring in the markets. Meanwhile, the remaining eight indicators sit on the fence and issue no signals at the time of writing.
The 24-hour Binance Coin price analysis shares this sentiment and shows 10 indicators in favor of further downwards movement against seven suggesting an upwards price action across the mid-term charts. The analysis reaffirms the bearish dominance over BNB. At the same time, nine indicators do not support either side of the market.
What to expect from the Binance Coin price analysis?
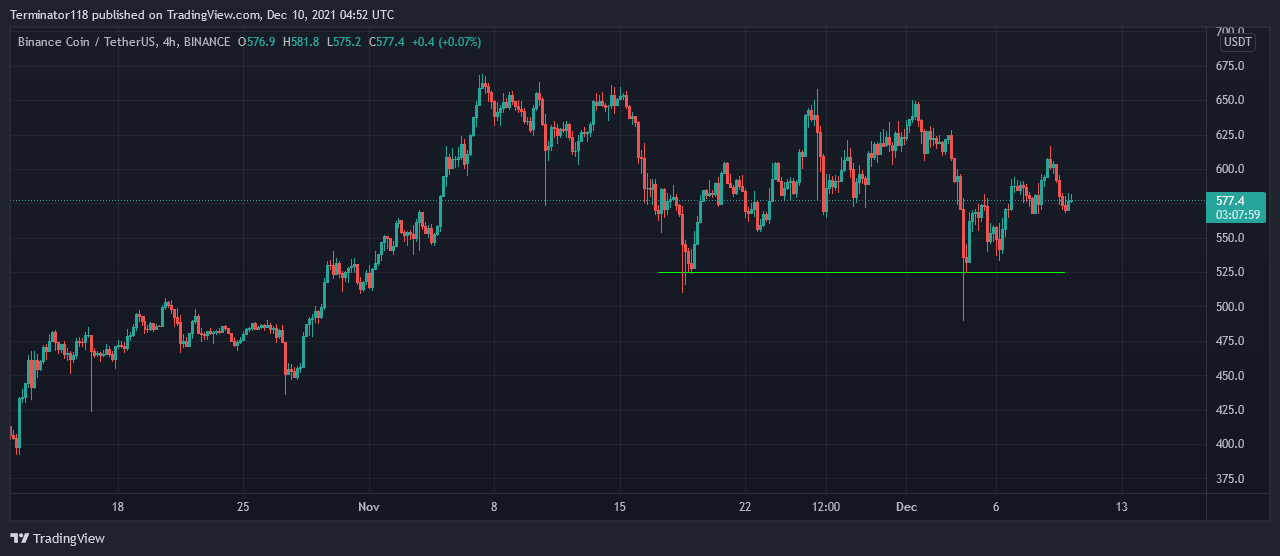
The Binance Coin price analysis shows that the buyers made an attempt at breaking past the $600 price level on December 8 but failed to establish support at the level and crashed back. The sharp upwards activity caused the price action to become unstable and the following decline caused BNB to fall to the $570.00 mark before the buyers could fight back.
Currently, traders should expect the Binance Coin price analysis to move upwards towards the $585.00 mark which presents a resistance to the buyers at press time. The short-term indicators are suggesting a bullish turnover suggesting further upwards movement towards the $600 mark. However, the mid-term technicals remain bearish suggesting further downwards movement. As such, if BNB is unable to break past $585, price may fall to $550 support.