- Polkadot price analysis is bullish today.
- Resistance for DOT/USD is present at $28.
- Support for DOT is present at $26.
The Polkadot price analysis is bullish today, as bulls have made a comeback after a great defeat. As we know, DOT has been on the decline for the past few weeks and is now trading below the $30 psychological limit, and yesterday also proved detrimental for the coin value as another big loss was observed. Despite the bullish move of today, DOT is still in pressure as the RSI is hovering quite low.
Currently, the price of DOT is resting on the 29th September support level after some bullish efforts but is still on the lower level of the last two months. The bulls seem to be in need of more strength to make any further improvement, and the next target is the $28 resistance level.
DOT/USD 1-day price chart: Price elevates to $27.3
The 24-hour Polkadot price analysis shows the crypto pair traded in a range of $26.7 to $27.7 today, and the cryptocurrency is trading hands at $27.3 at the time of writing. The DOT/USD pair also reports a loss in value by 6.5 percent over the last 24 hours as the recovery is still on the smaller side, and if observed over the past week, the loss in value amounts to more than 23 percent as the overall trend is downwards. The trading volume is also down by 7.22 percent, and the market cap has decreased by 5.02 percent.
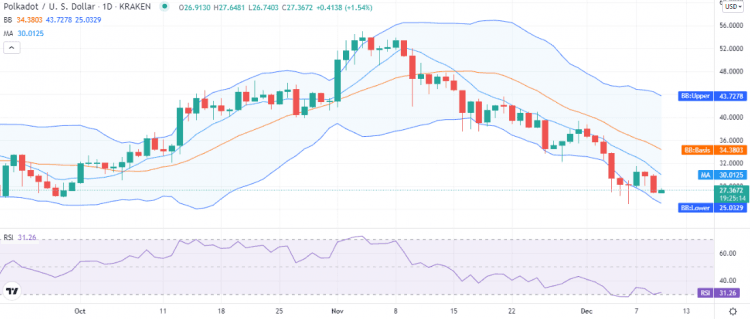
The volatility is high, as the Bollinger bands are covering more area, the upper band is present at the $43 mark, and the lower band is present at the $25 mark representing support for DOT, the average of the indicator is forming at the $34 mark representing resistance for the DOT/USD. The moving average (MA) is trading at the $30 mark.
The relative strength index (RSI) is on a very slight upwards curve, near the borderline of the oversold region at index 31, indicating low bullish momentum and high market pressure.
Polkadot price analysis: Recent developments and further technical indications
The 4-hour Polkadot price analysis shows the price breakout is upwards today after a continuous downslide of yesterday. However, the bullish momentum is not steady enough, and bulls are lacking the strength to make a good push through.
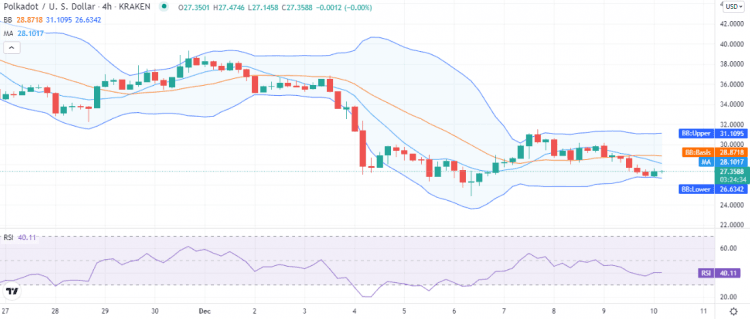
The volatility is mild on the 4-hour chart, as the upper band is present at the $31 mark, and the lower band is present at the $26 mark representing support for DOT, the average of the indicator is forming at the $28.8 mark representing resistance for the DOT.
The RSI has come up to index 40 after a slight improvement, but the curve has again straightened out. The indicator suggests the reversal of bullish efforts might be observed in the coming hours.
Polkadot price analysis conclusion
The Polkadot price analysis suggests the bulls have shown some progress today, but they haven’t yet got the strength to make further advancement. If bullish momentum continues and gains strength, then DOT might break above the $28 resistance. On the other hand, if market pressure exceeds as it is already quite high, then DOT may revisit the $26 range.
Disclaimer. The information provided is not trading advice. Cryptopolitan.com holds no liability for any investments made based on the information provided on this page. We strongly recommend independent research and/or consultation with a qualified professional before making any investment decisions.