The bullish breakout of the falling channel teases a bull run to create a new 52-week high and help the XTZ coin price reach the $10 mark.
Tezos is aiming to provide an infrastructure that is more advanced. This means it can grow and improve over time, without ever running into the danger of a hard fork. This is something both Bitcoin and Ethereum have experienced since their creation. XTZ holders can vote on the Tezos developers' proposals for protocol upgrades.
Read more to know more about the technical analysis of the Tezos token.
Past Performance of XTZ
The XTZ coin prices have been falling since the rejection near the $9.18 mark. Thus, resulting in the falling channel pattern in the daily chart. The falling channel resulted in a downfall of more than 50%.
However, the prices found support near the $4 support zone that pushed the prices higher. Thus, resulting in the bullish breakout of the falling channel.
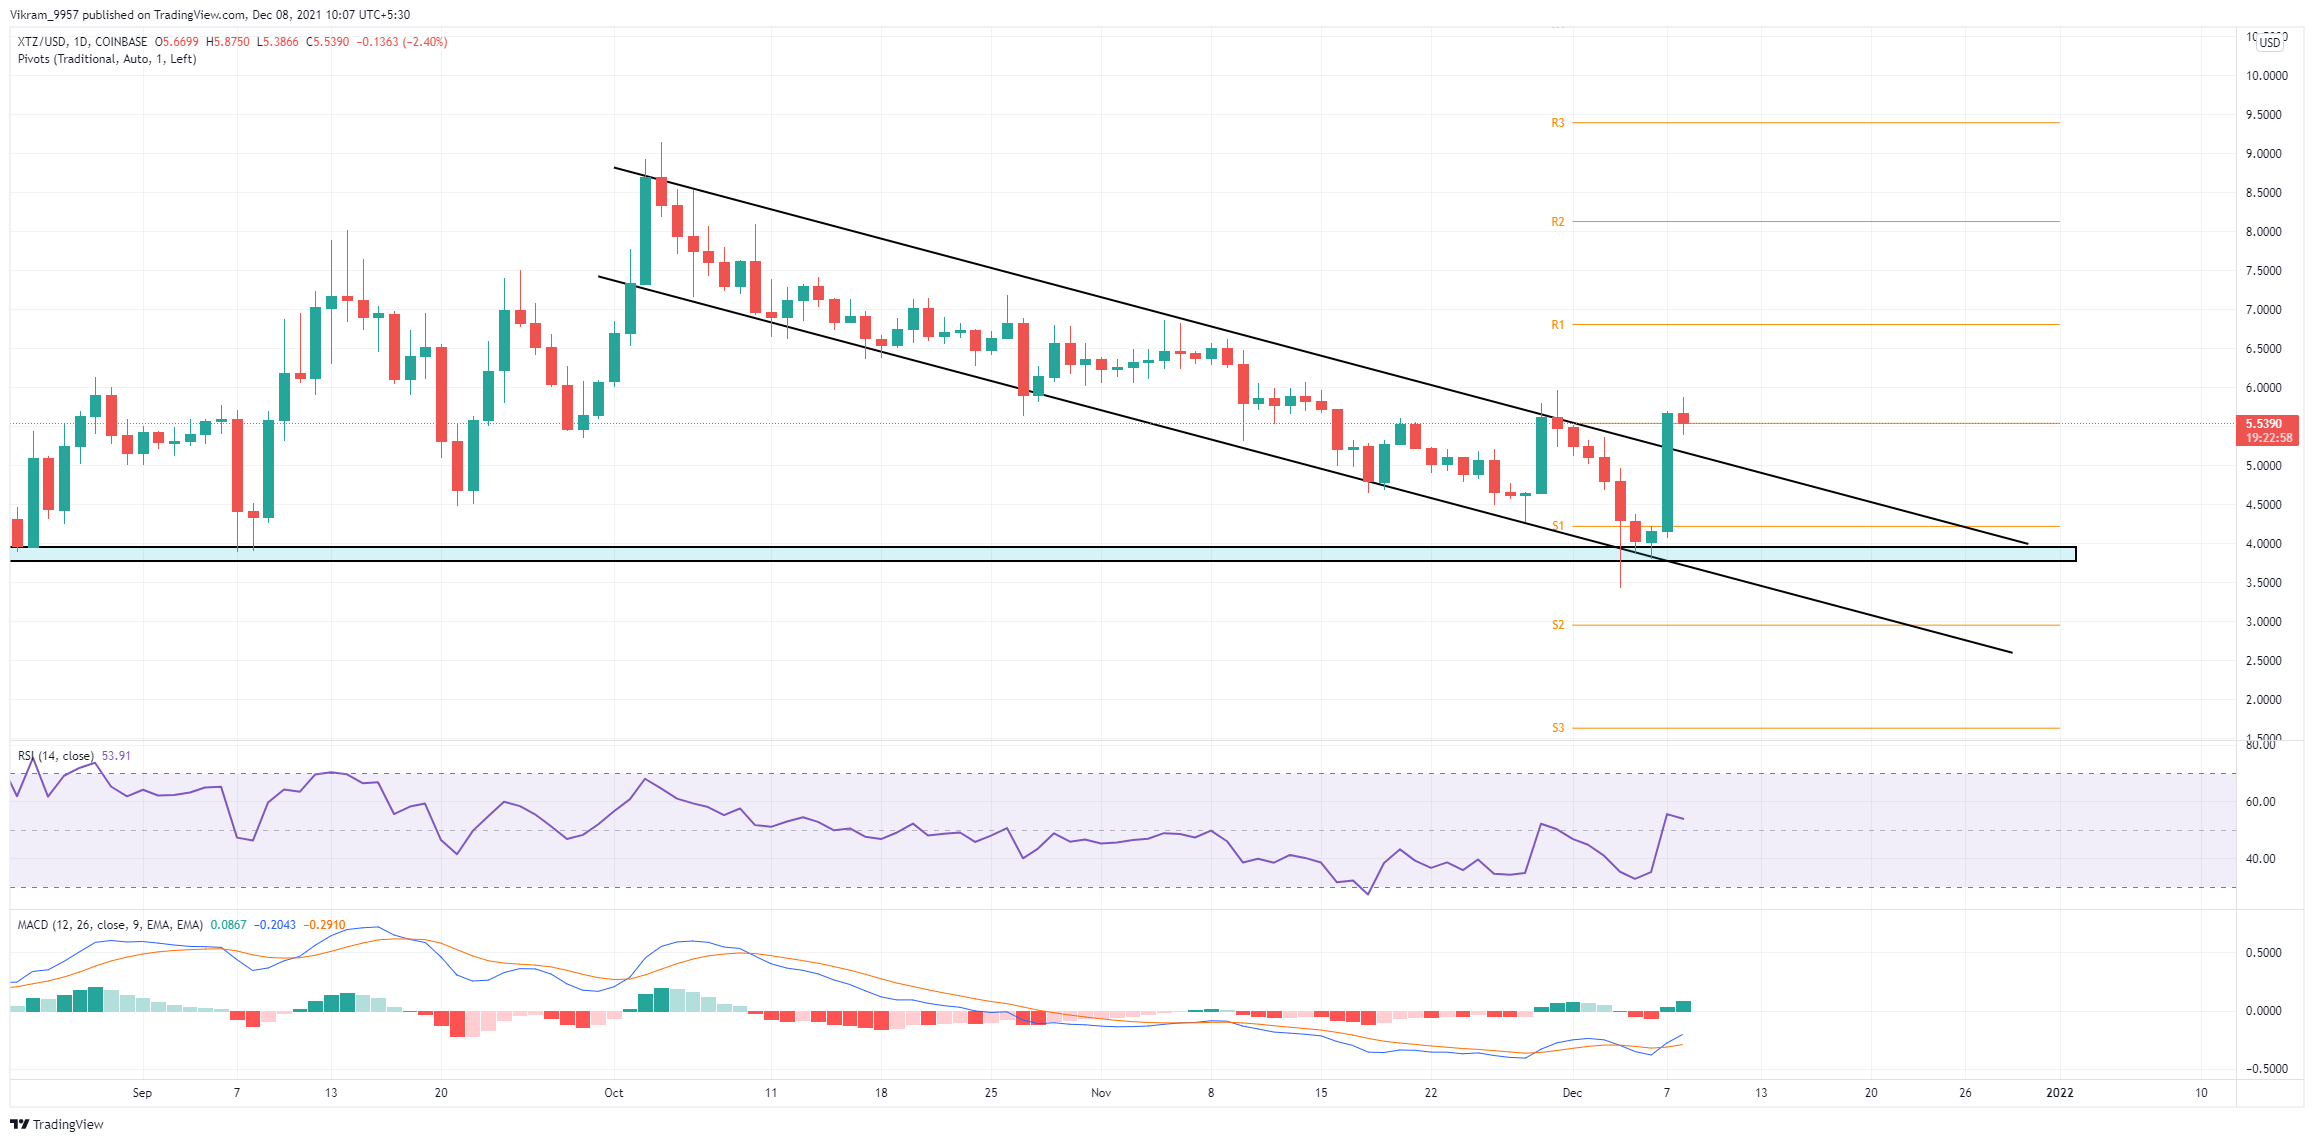
XTZ/USD Daily Chart
XTZ Technical Analysis
The XTZ token price is currently trading at $5.56 with an intraday gain of 35%. Thus, resulting in the bullish engulfing candlestick in the daily chart. However, we can observe a little retracement in the coin price to retest the resistance trendline.
This bullish breakout can be a lucrative entry point for traders. However, it is best to wait until the price reaches $6. This will prevent them from falling for any bull traps in the chart.
The price action and pivot points indicate the following upside target at $6.8 to $8. In the event that the $4 zone collapses the falling prices may find refuge at $3.
The RSI indicator shows significant chances of a bull run as the slope spikes above the central line in the daily chart. And, in the 4-hour chart, the slope enters the oversold zone forecasting a short retracement to retest the breakout.
The MACD indicator projects the fast and slow line rising higher in the 4-hour chart Moreover, the lines give a bullish crossover as they approach the zero line to enter the positive territory.
Upcoming Trend
The XTZ coin's price showed a remarkable bull run and a 50% correction within a matter of weeks. However, technical indicators and price action suggest that the coin may experience a bullish correction which could lead to new heights by 2022.
Traders should avoid falling prey to the bull trap that could arise from price action. Traders should therefore wait for the price to retest successfully. Bullish targets can range from $8 to $10 with stop losses below $4.5, depending on risk appetite.