The Crypto Market Cap (TOTALCAP), Bitcoin (BTC), and BLUR did not sustain their bounces yesterday.
In the news today:
- The SEC postponed its decision on the spot Ethereum ETF, extending it by 45 days to March.
- The IRS modified its approach to cryptocurrency reporting on tax returns, broadening digital asset inquiries.
TOTALCAP Retests Resistance
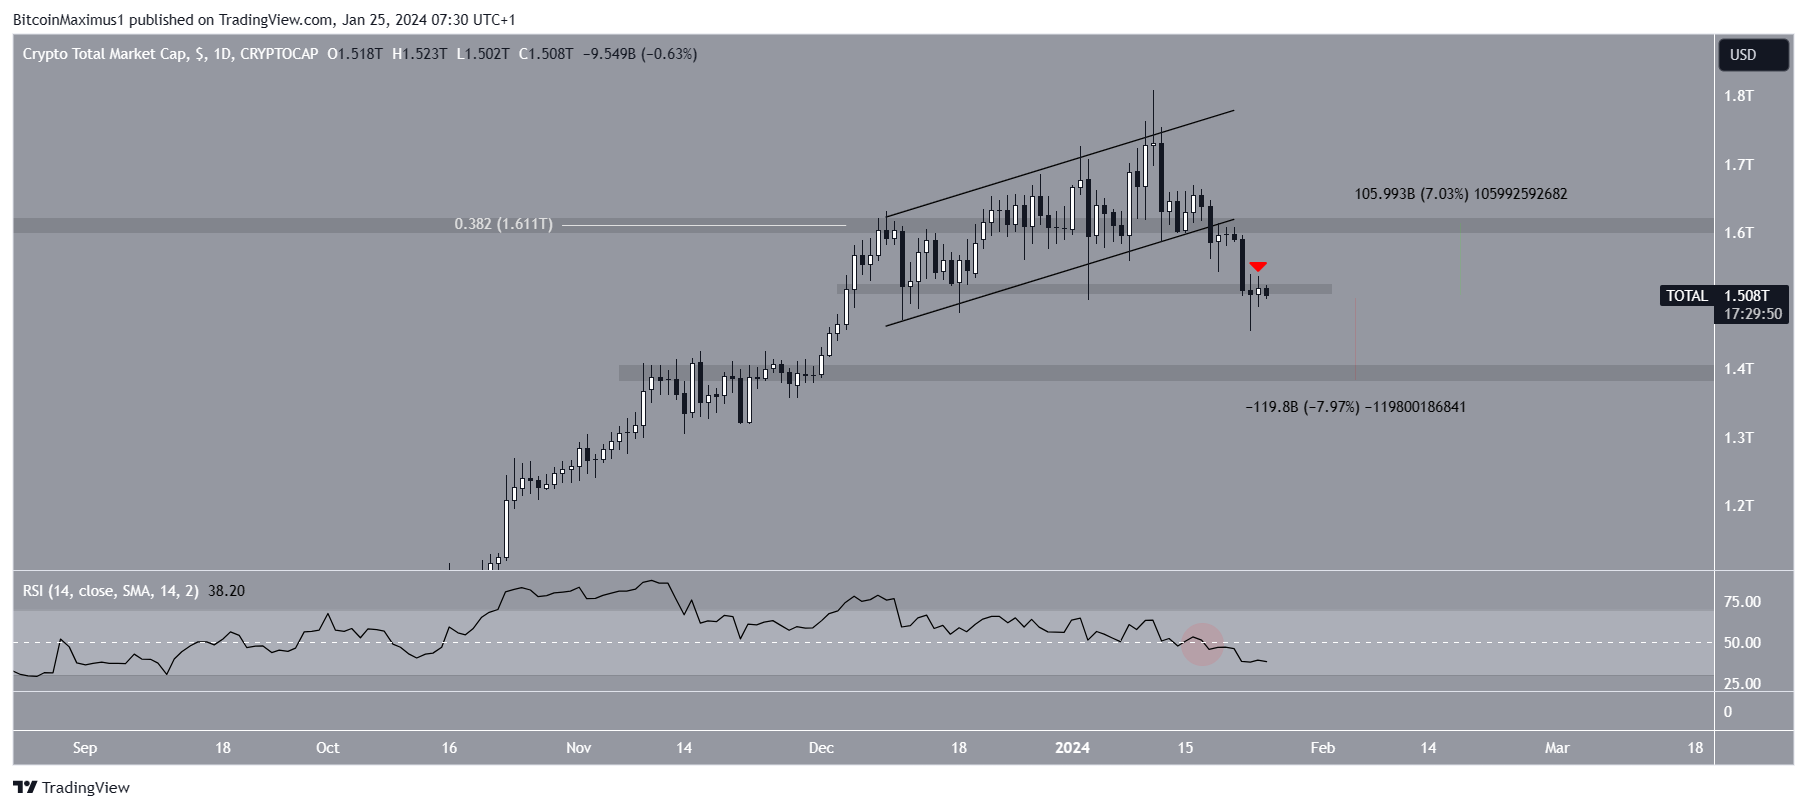
The cryptocurrency market cap has traded inside an ascending parallel channel since December 9, 2023. The increase led to a high of $1.81 trillion on January 11, 2024.
The price has fallen since and broke down from the channel on January 18, also falling below the $1.61 trillion support area, which is the 0.382 Fibonacci level.
On January 23, TOTALCAP decreased below the $1.52 trillion support area. While it bounced afterward, it did not reclaim the horizontal area but rather validated it as resistance (red icon
The daily RSI gives a bearish reading. The indicator fell below 50 (red circle) for the first time since the upward movement began in October 2023.
If the decrease continues, TOTALCAP can fall 8% to the next closest support at $1.39 trillion.

Despite this bearish TOTALCAP prediction, a strong bounce can trigger a 5% increase to the $1.61 trillion area, which will likely act as resistance.
Bitcoin Does Not Reclaim Range
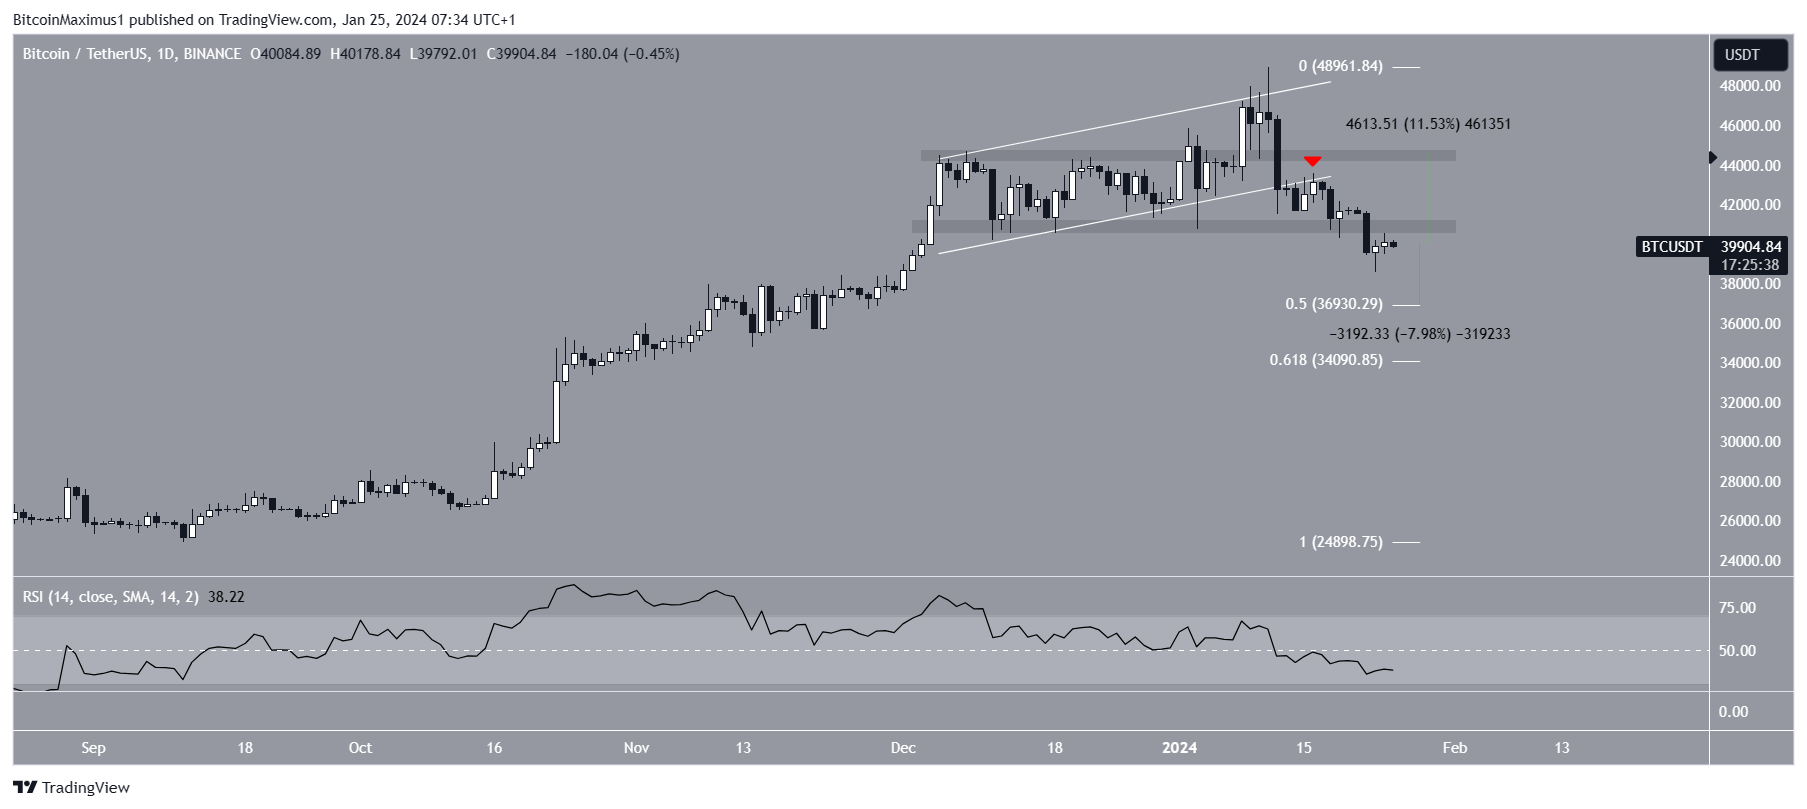
The Bitcoin price has traded inside an ascending parallel channel since December. However, it broke down from the channel on January 12, 2024. This is a sign that the upward movement has ended.
After a rejection from the channel’s support trend line on January 16 (red icon), BTC resumed its downward movement. The decrease accelerated on January 22, causing a breakdown from the $41,000 horizontal support area. The BTC price fell to a low of $38,505, below the 0.382 Fib retracement support level.
While the BTC price bounced afterward, it did not reclaim the $41,000 horizontal area. Similarly to TOTALCAP, the daily RSI is bearish.
If the decrease continues, Bitcoin can fall 8% to the 0.5 Fib retracement support level at $36,950.

Despite this bearish BTC price prediction, reclaiming the $41,000 area can trigger a 11% increase to the next resistance at $44,500.
BLUR Deviates Above Resistance
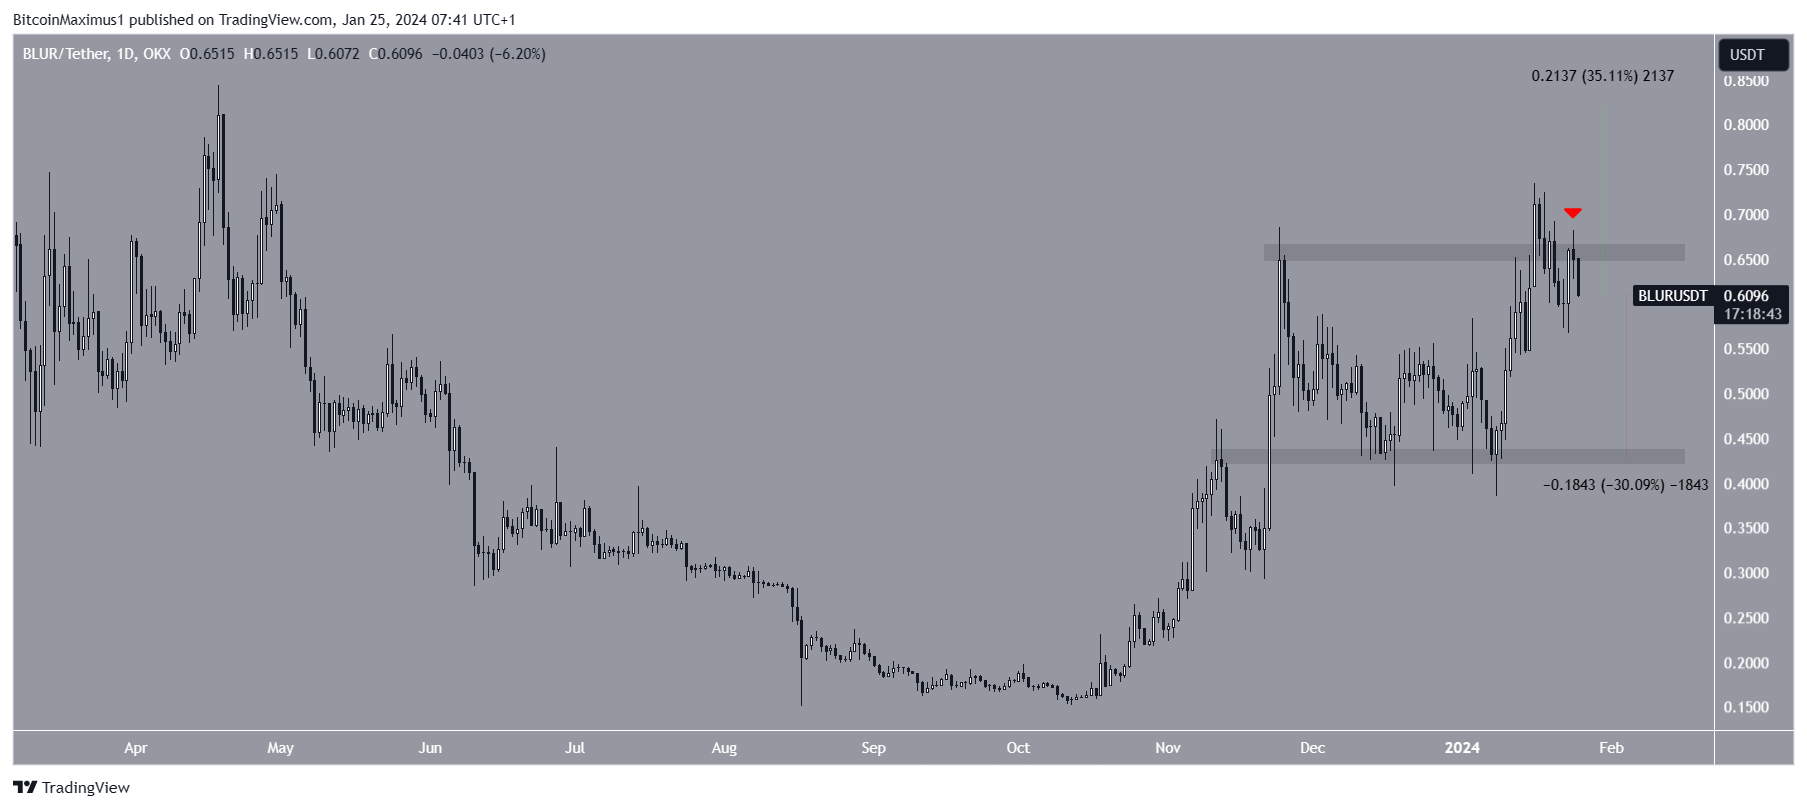
The technical analysis of the daily time frame shows that the BLUR price broke out from the $0.65 horizontal resistance area on January 16. However, the price could not sustain its upward movement.
Rather, it fell below the area and validated it as resistance yesterday (red icon). This confirmed the deviation above the resistance area (red circle).
If the decrease continues, BLUR can fall 30% to the closest support at $0.43.

Despite this bearish BLUR price prediction, closing above the $0.65 area can cause a 35% increase to the next resistance at $0.80.
For BeInCrypto‘s latest crypto market analysis, click here.
Disclaimer
In line with the Trust Project guidelines, this price analysis article is for informational purposes only and should not be considered financial or investment advice. BeInCrypto is committed to accurate, unbiased reporting, but market conditions are subject to change without notice. Always conduct your own research and consult with a professional before making any financial decisions. Please note that our Terms and Conditions, Privacy Policy, and Disclaimers have been updated.
 beincrypto.com
