- 1 BLUR price showcased range bound moves over the past few sessions.
- 2 Buyers are gaining traction and trying to exit the cage.
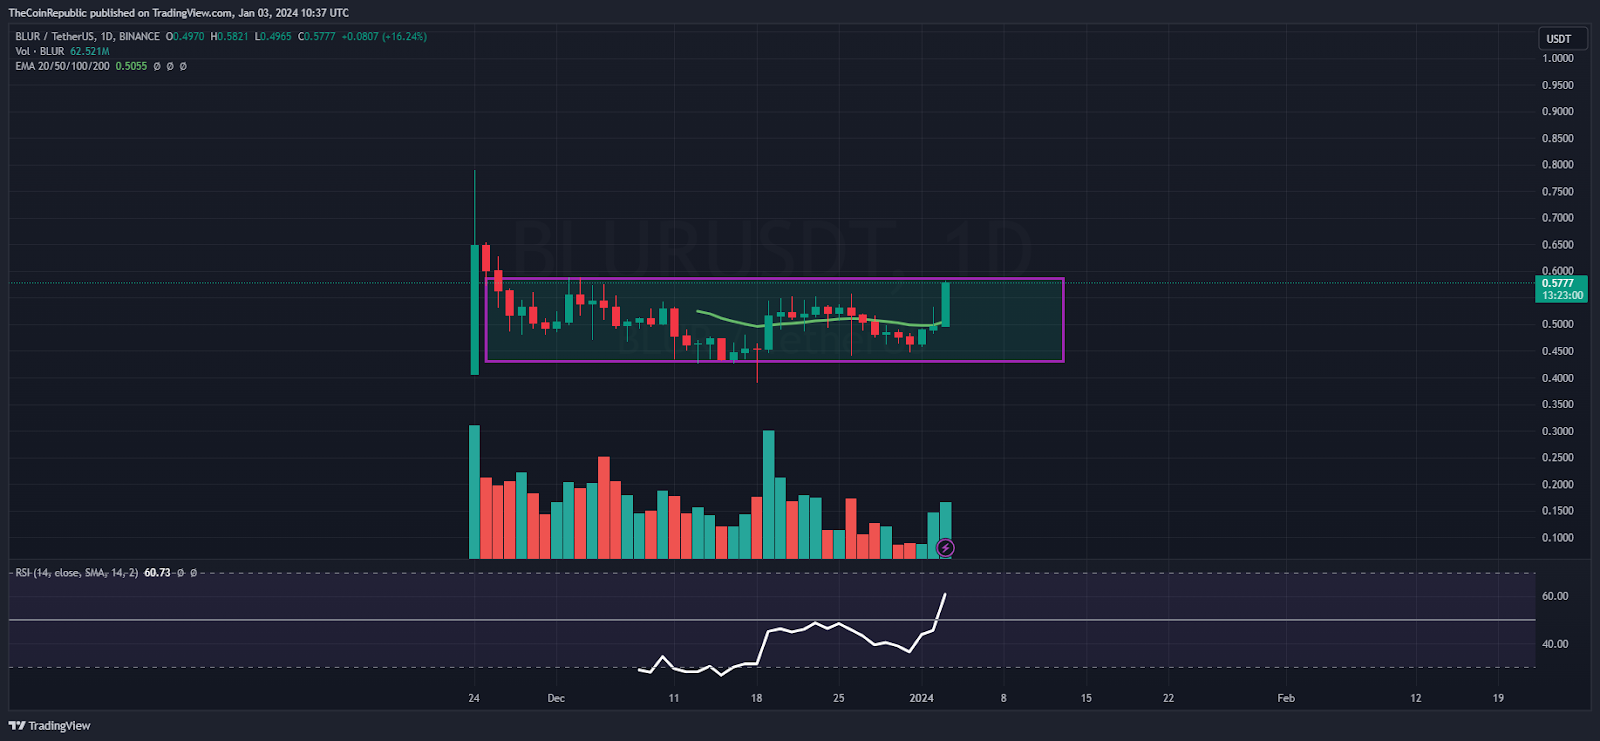
BLUR price is in a narrow congestion zone and is hovering near its resistance zone of $0.6000, where rejection was noticed multiple times. However, BLUR price pulled back from there and exhibited a bounce, forming a bullish marubozu candlestick in yesterday’s session. Additionally, the price action depicts the indecisiveness between the bulls and bears, where the BLUR token is in a dilemma and has paused the gains.
BLUR token is trading close to the critical hurdle of $0.6000, signaling a fresh buying momentum in the recent sessions. Buyers are eager to surpass the cage and want to achieve the swing high of $0.6500. Additionally, the trend is intact, and the BLUR token has handled the gains amid the weak global sentiments in the past sessions. The BLUR token is ready to glimpse bullishness and is at a make-or-break zone.
At press time, the BLUR token was trading at $0.5776 with an intraday gain of 10.92%, showing a solid pullback on the chart. Moreover, the trading volume witnessed a spike of 39.80% to $320.04 Million, directing investor interest. The pair of BLUR/BTC rose to 0.00000128 BTC, while the market cap is $695.50 Million. Analysts have maintained a neutral rating and suggest that the BLUR token may acquire further gains in the following sessions.
BLUR on Hourly Chart Reflects Breakout

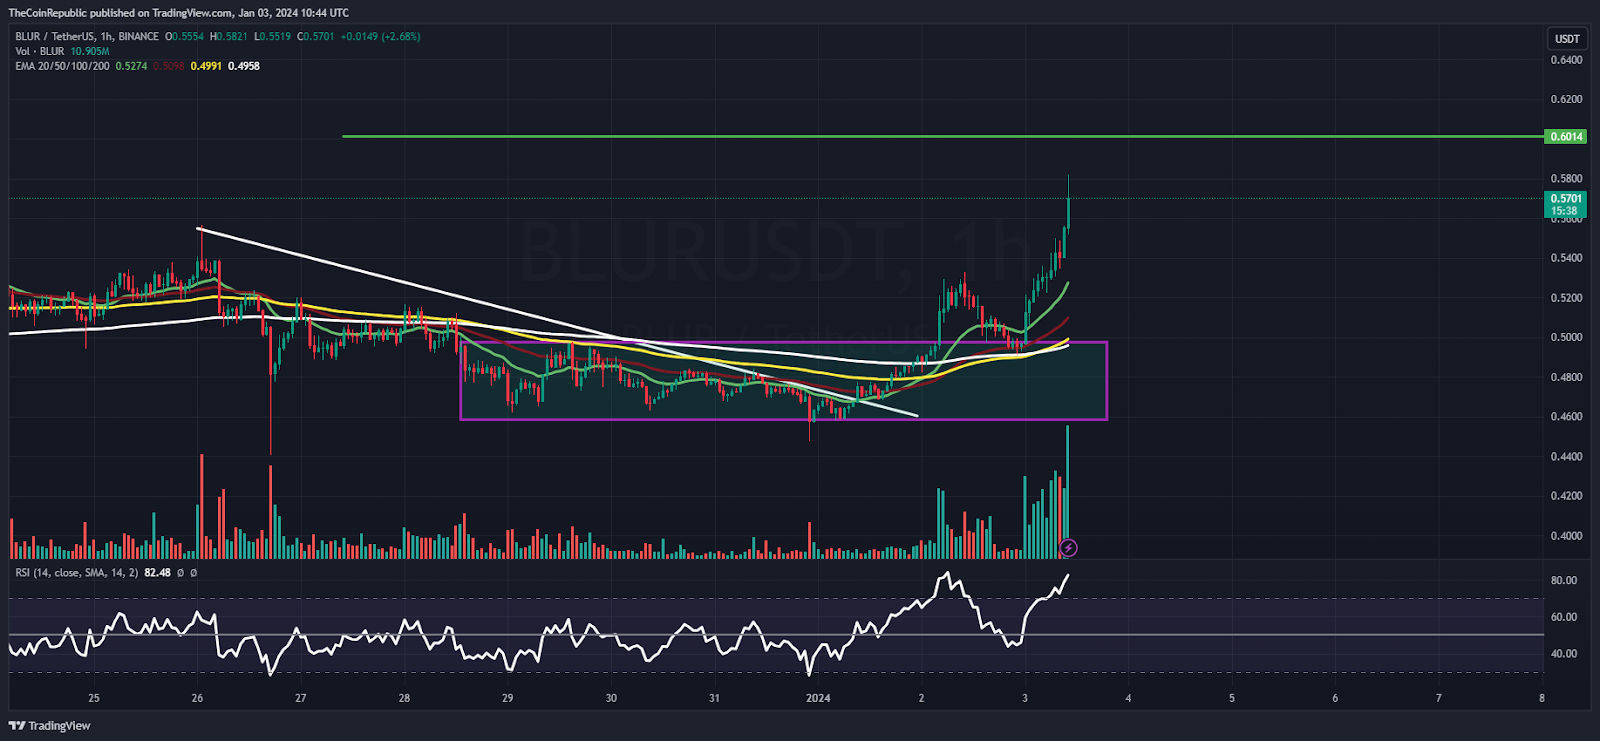
On the hourly chart, the BLUR token has reversed the craze, reversed from the bottom mark of $0.4500, and surged over 20% in recent sessions. A bullish crossover was also witnessed, and a fresh higher high swing was exhibited in the recent sessions. Per the Fibonacci retracement levels, the BLUR token has surpassed the 38.2% zone and is eyeing to surpass the 50% zone above $0.6000.
BLUR on Daily Chart Displays Range Bound Move

On the daily chart, the BLUR token price is hovering in a biassed range and exhibits a cage-like setup, where buyers are unsuccessfully trying to smash the upper neckline of $0.6000. However, a pullback from the 20 day EMA showcased the buyer intention and their aggressiveness to climb above the bars.
The relative strength index (RSI) curve stayed in the overbought zone near 75, showcasing a positive divergence reflecting a fresh buying momentum that may lift the BLUR token above $0.6000 soon. The MACD indicator showed a bullish crossover and formed green bars on the histogram, suggesting that the BLUR token may outperform in the following sessions.
Summary
BLUR token has gained momentum and showed fresh buying momentum, heading to scratch the immediate hurdle of $0.6000. Additionally, the bear cartel has trapped and is covering their short positions, whereas buyers have persisted in adding long positions, resulting in the extension of pullback.
Technical Levels
Support Levels: $0.5500 and $0.5300
Resistance Levels: $0.5800 and $0.6000
Disclaimer
The views and opinions stated by the author or any other person named in this article are for informational purposes only and do not constitute financial, investment, or other advice. Investing in or trading crypto or stocks comes with a risk of financial loss.
Nancy J. Allen is a crypto enthusiast, with a major in macroeconomics and minor in business statistics. She believes that cryptocurrencies inspire people to be their own banks, and step aside from traditional monetary exchange systems. She is also intrigued by blockchain technology and its functioning. She frequently researches, and posts content on the top altcoins, their theoretical working principles and technical price predictions.
 thecoinrepublic.com
