Bulls have lost control of bears as the global market cap decreased by 1.41% in the last 24 hours to stand at $1.67 as of press time. The trading volume has also dropped by 10% in the last 24 hours to $73.5B.
Bitcoin Price Analysis
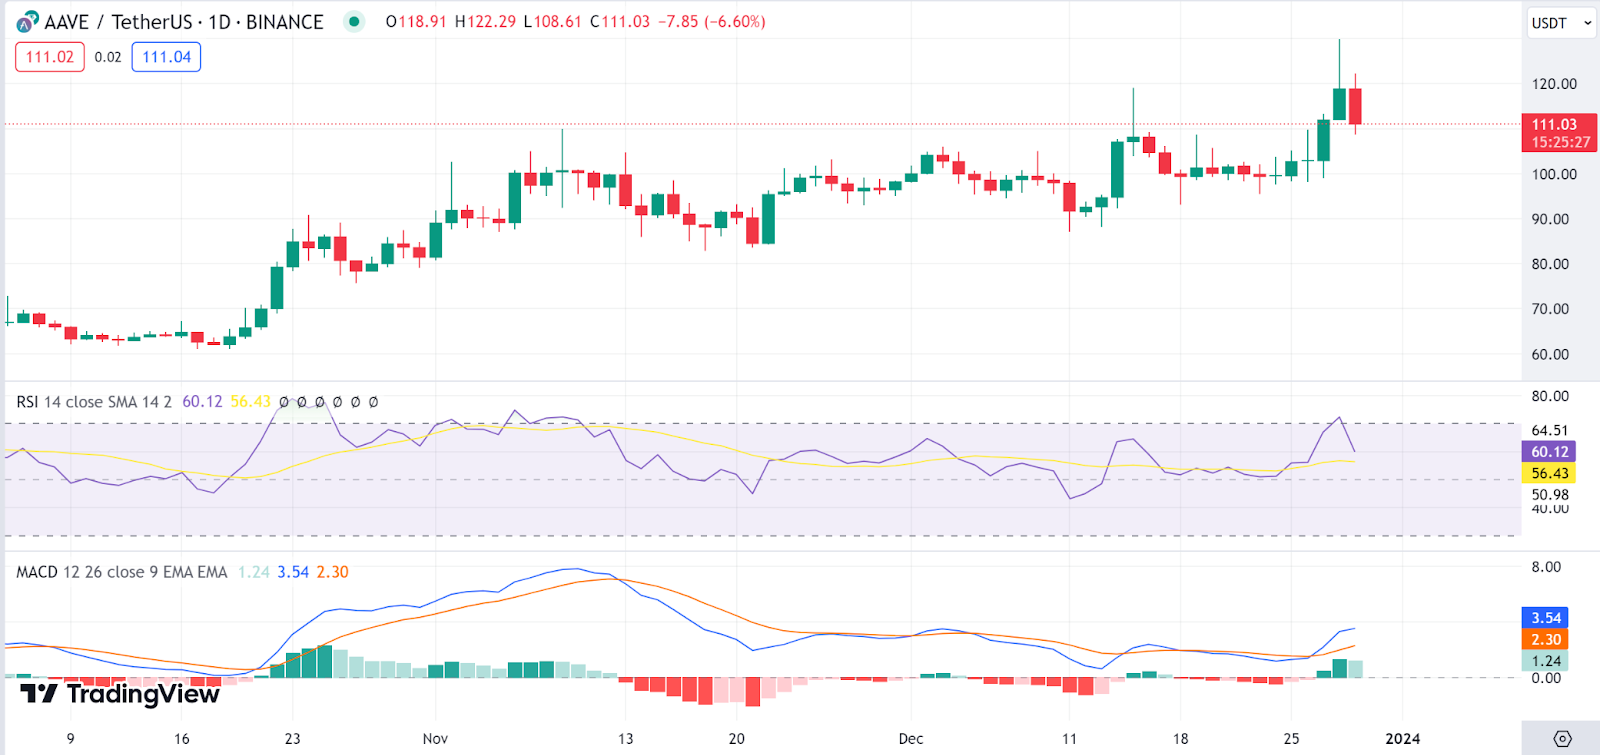
The Bitcoin price has fallen prey to today’s bear sentiment as it plunged by 1.3% as of press time to trade at $42.4K. This plunge has brought Bitcoin (BTC) 2.2% below its previous seven-day price, as the trading volume also dropped by 14%.
Looking at in-depth analysis, the Relative Strength Index indicator is on a downward trajectory as the MACD indicator also moves in the red zone. This shows bearish momentum on Bitcoin.
Ethereum Price Analysis
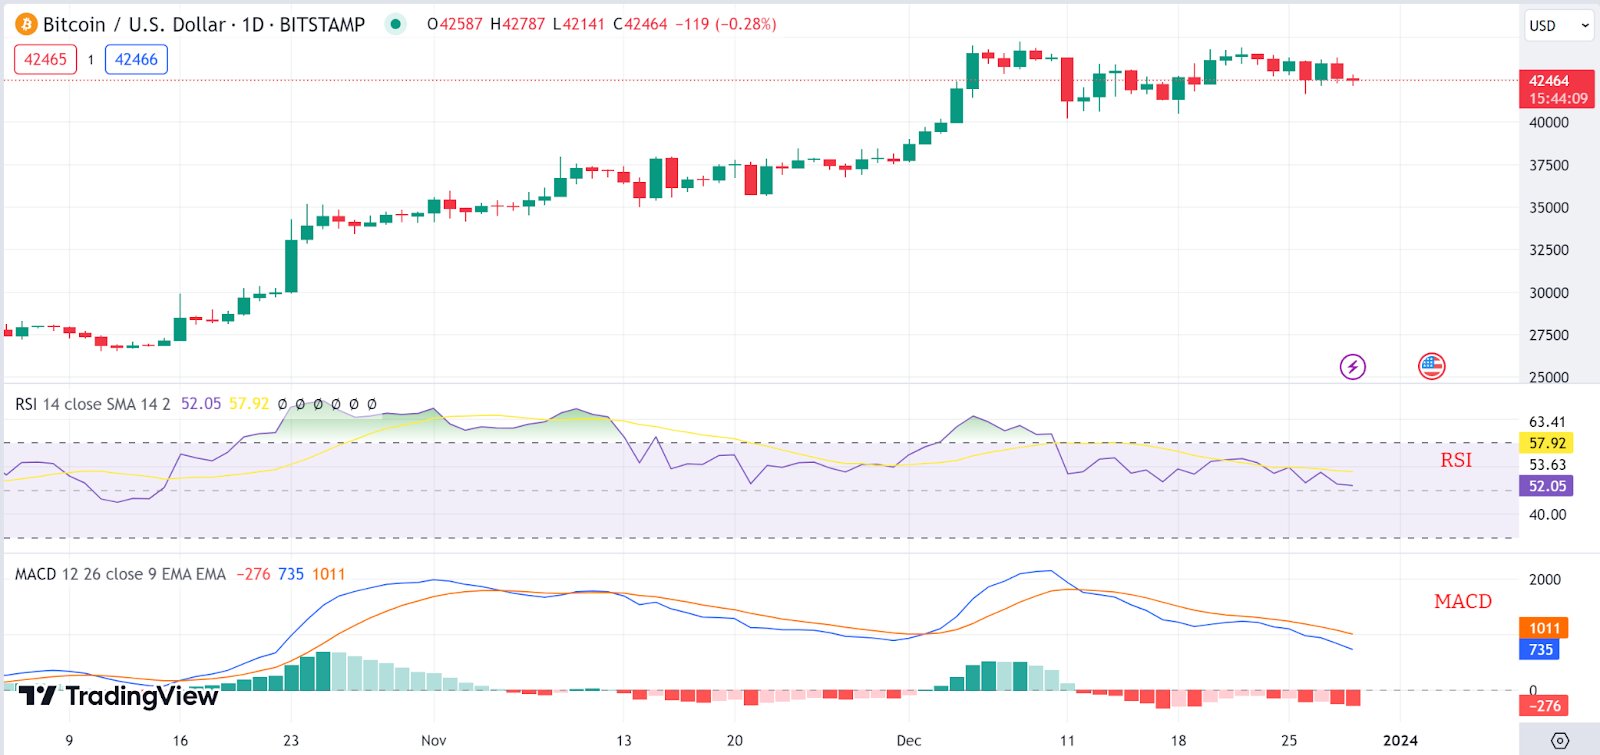
The Ethereum price has also plunged by 1% as of press time to trade at $2345. Ethereum (ETH), however, is still 2.3% from its previous 24-hour price as the trade volume dropped by 23% as well within the same period to stand at $13.4B.
However, despite the drop, the Relative Strength Index indicator has reverted from its downward trajectory, showing fading bearishness on the Ethereum price. This points towards a bullish short-term on Ethereum as bulls fight to regain control.
Skale Price Analysis
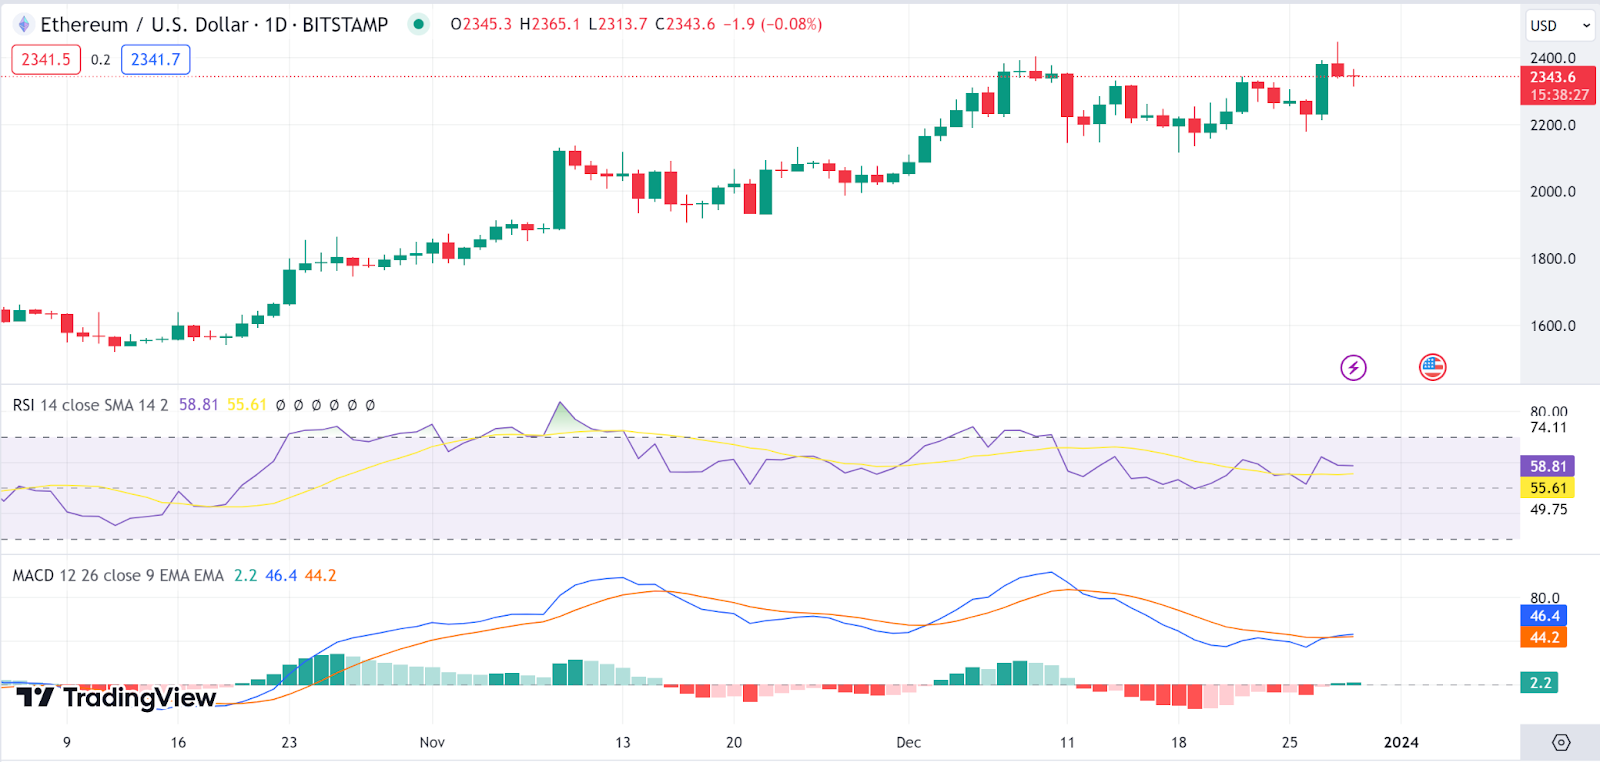
The Skale price is also facing corrections from its recent pump, which has seen it pump by 49% from its previous seven-day price. Today’s bear activity has seen Skale (SKL)correct by 7% from its previous 24-hour price to trade at $0.7797
The Relative Strength Index indicator is also moving south as it approaches an exit from the overbought region, showing mounting selling pressure. Looking at volatility, the Bollinger Bands are diverging, suggesting high volatility on the Skale price.
PanCake Swap Price Analysis
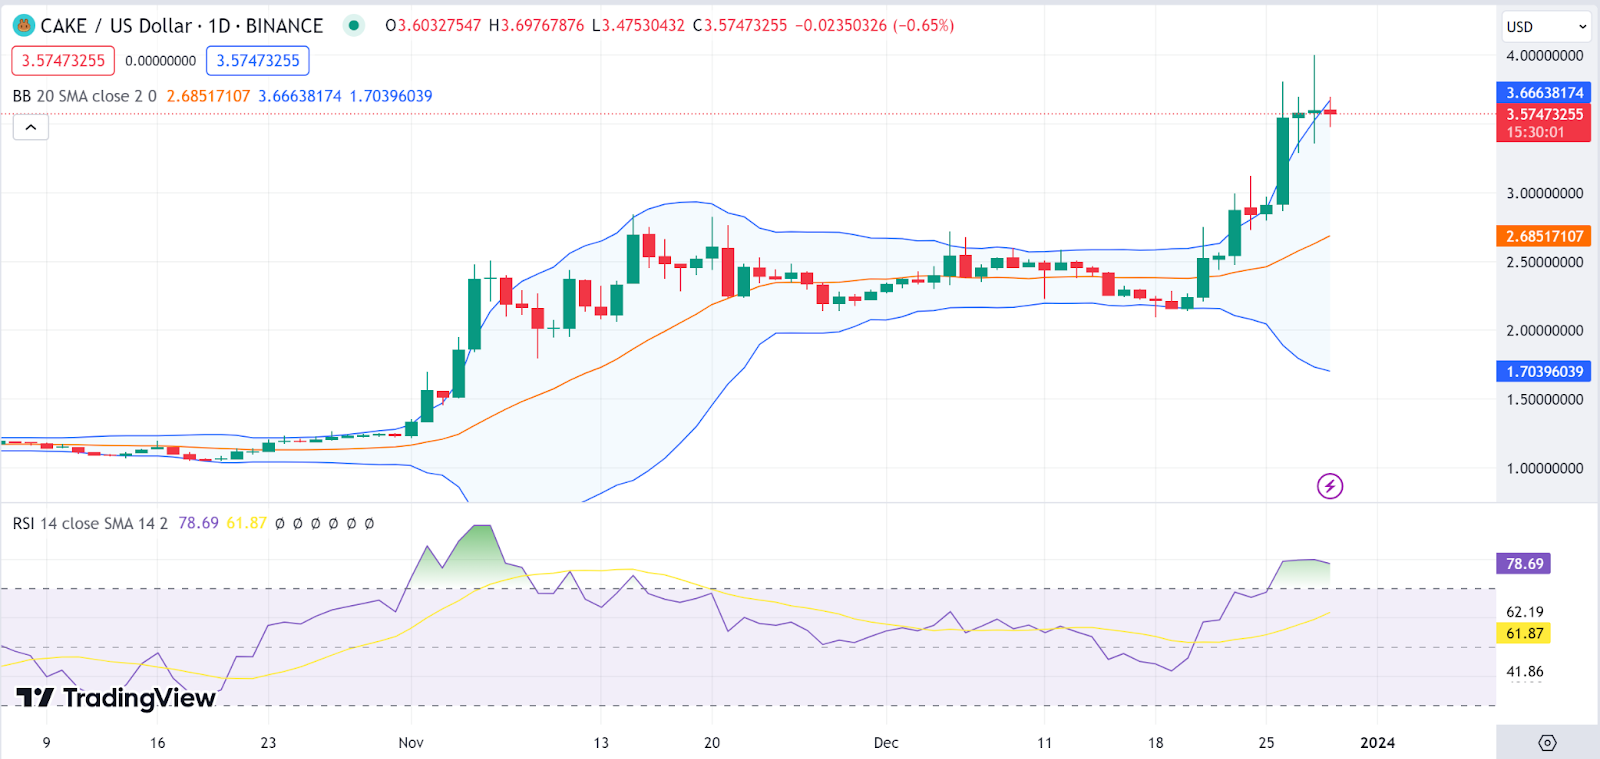
The PanCake Swap price has also plunged by 1.7% as of press time to trade at $3.6. This comes as the meme coin faces a correction, having pumped by 46% from its recent seven-day price amid the recent bull market.
Pancake Swap’s (CAKE) Relative Strength Index indicator is also moving south as it approaches an exit from the overbought region, showing mounting selling pressure on the token. Looking at volatility, the Bollinger Bands are diverging, suggesting high volatility in the CAKE price.
Aave Price Analysis
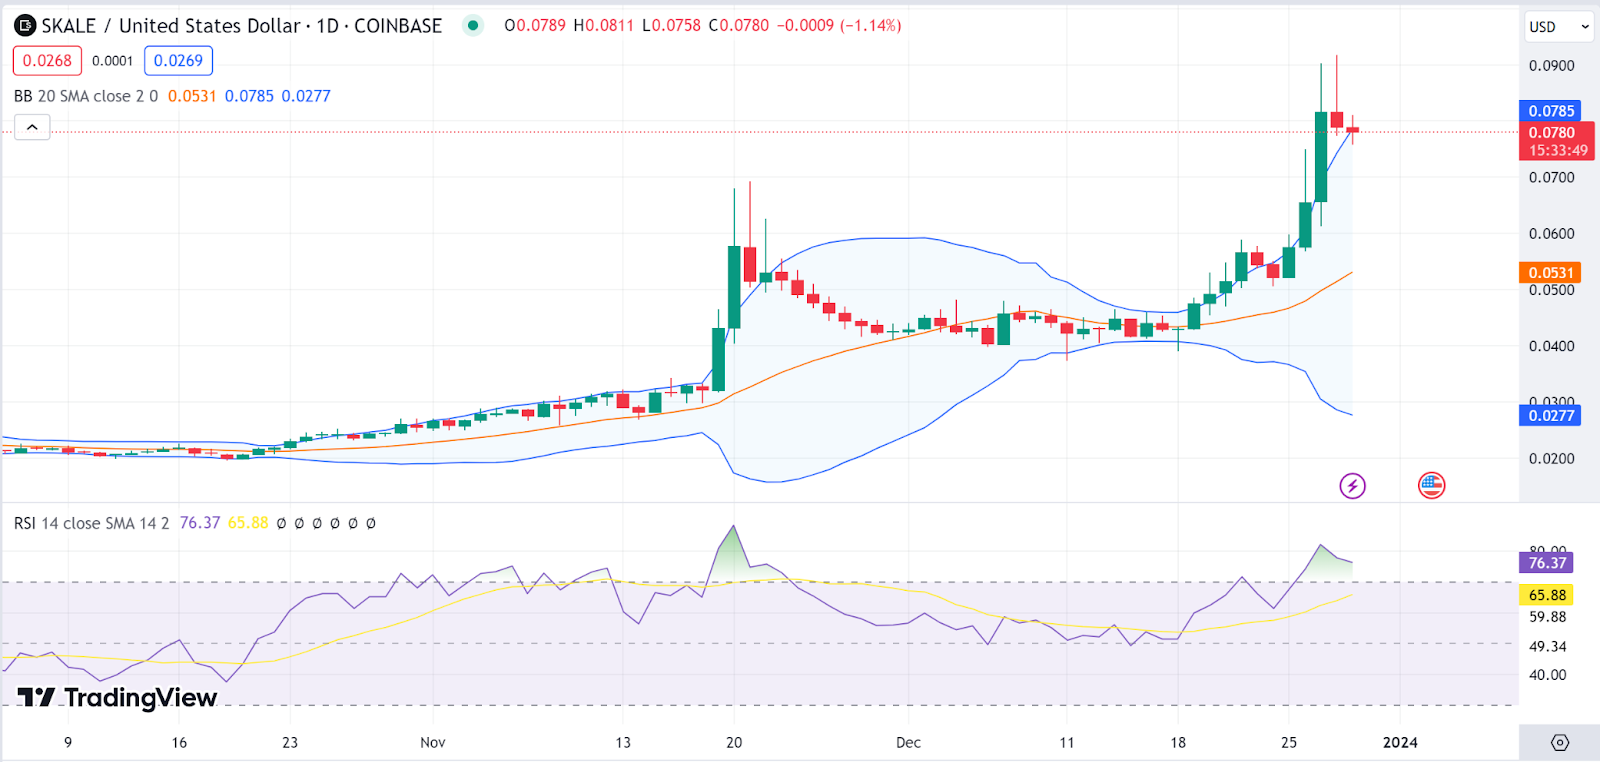
The Aave price has also plunged by 9.4% as of press time to trade at $110.5. This comes as the it faces a correction, having pumped by 10% from its recent seven-day price amid the recent bull market.
Aave’s (AAVE) Relative Strength Index indicator is also moving south as it approaches an exit from the overbought region, showing mounting selling pressure on the token. The MACD is also reverting toward the red zone, also backing the bear prospects on Aave.
