- 1 VET price exhibited buying momentum and persisted in accumulating gains.
- 2 Buyers are displaying a boost in strength, gaining traction in recent sessions.
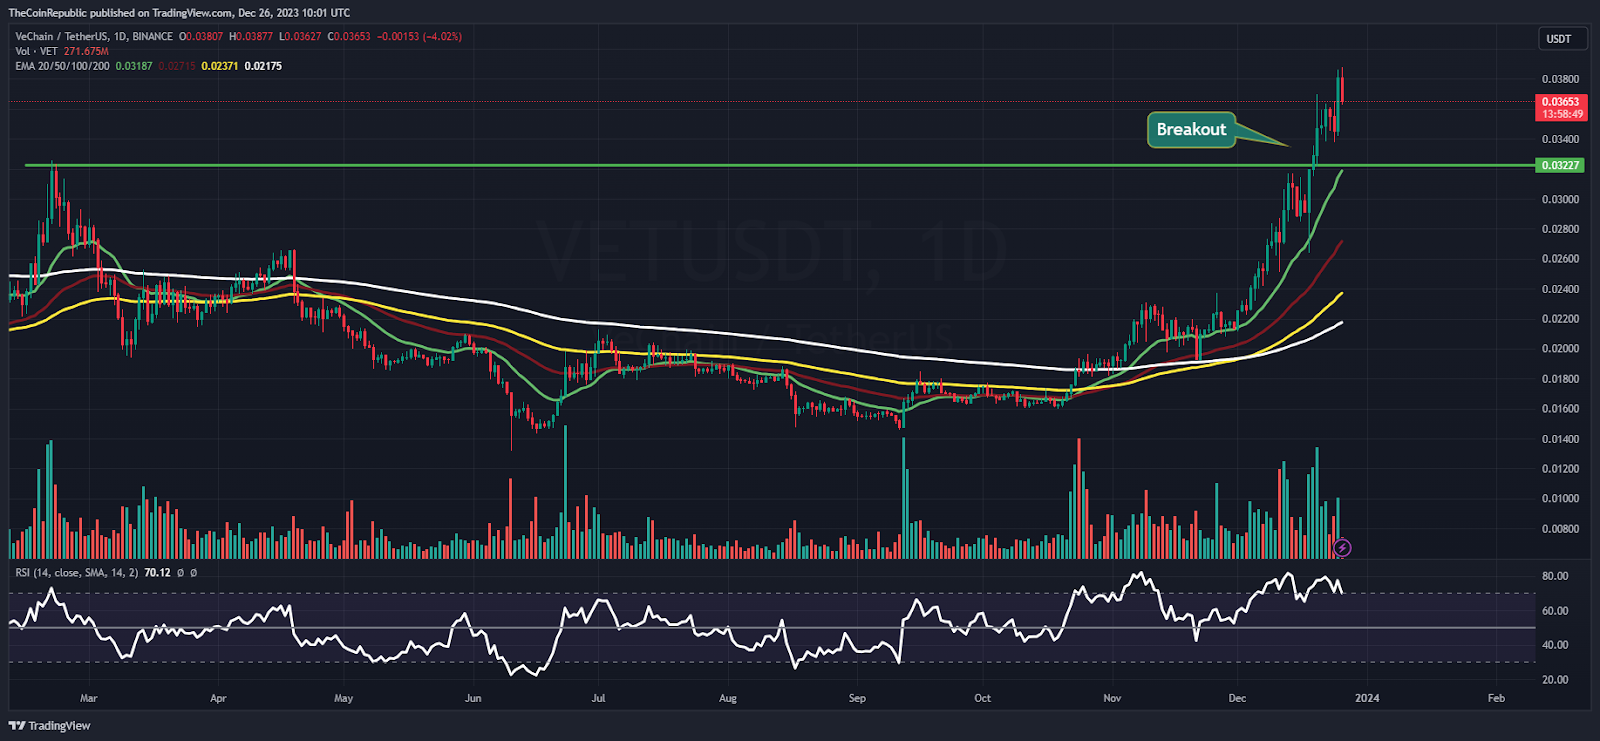
VET price fled the vital hurdle of $0.03000 and broke out with dashing hues in recent sessions. For the past sessions, the VET price has shown a pullback from the 20-day EMA and is extending the gains price action, conveying that buyers are holding their strength and are setting their eyes on claiming the supply zone of $0.04000. Additionally, the short covering move was displayed on the charts; VET price showcased follow-on buying and is upholding gains in the bullish trajectory zone above $0.03000.
VET price has surpassed the resistance zone of $0.03200 and is approaching the bullish territory mark, offering a breakout in the recent sessions. Furthermore, the price action displayed bullish momentum, and sellers looked trapped. Per the Fibonacci retracement levels, the VET price has escaped the 61.8% zone and is holding the gains beyond the mid bollinger band.
The live price of VET crypto is $0.03678, with an intraday gain of 7.46 %, showing bullishness on the chart. Moreover, the trading volume increased by 4.39% to $148.88 Million. However, the pair of VET/BTC is at 0.000000872 BTC, and the market cap is $2.50 Billion. Analysts have maintained a bullish rating, suggesting the outperformance will continue in the following sessions.
VET Price Displays A Rally on Daily Chart

On the daily charts, VET displayed a range breakout, mended from the lows of $0.01400, and surged over 150% in the recent sessions. However, investors are still putting in efforts and trying to extend the rally to reach $0.04000. Additionally, the buyers have shown their dominance and scratch the sellers grip, where they maintained their positions, resulting in higher highs formation.
The relative strength index (RSI) curve stayed in the overbought zone and formed a positive divergence, suggesting that the outperformance will continue in the following sessions. The MACD indicator showed a bullish crossover and formed green bars on the histogram indicating the bulls dominance.
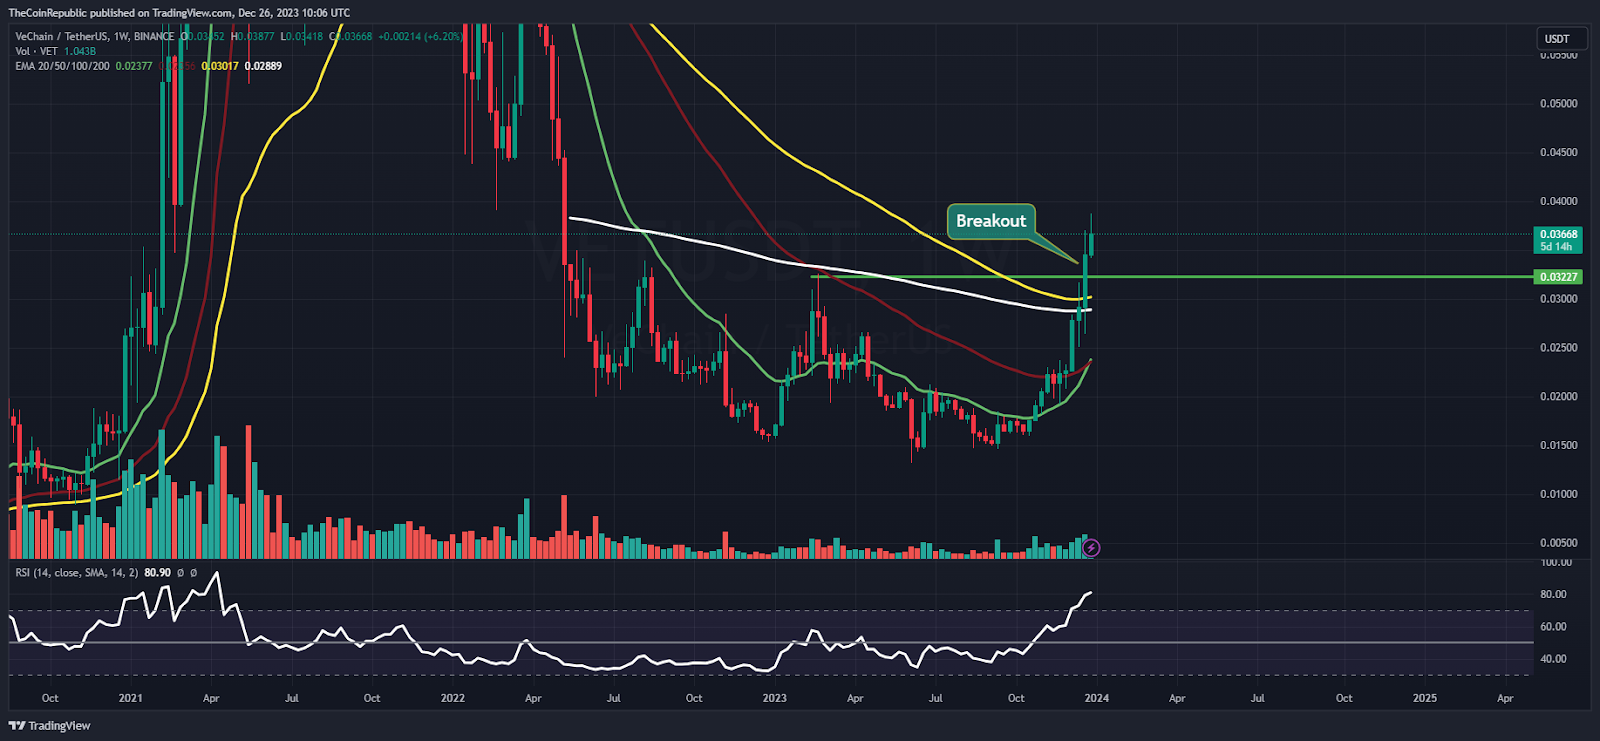
Weekly Charts Exhibit Trend Reversal

On the weekly chart, VET price broke out of the double bottom formation and split the neckline hurdle of $0.03000. Moreover, the price action displays the buyers’ accumulation and exhibits a positive crossover.
Summary
VET price showcased a massive rebound from the demand zone of $0.02000 and persisted in surge for the past sessions. Following the market rally, VET crypto participated decently, displaying strong bullishness on the chart. The RSI and the MACD confirm the bullishness.
Technical Levels
Support Levels: $0.03500 and $0.03200
Resistance Levels: $0.03800 and $0.04000
Disclaimer
The views and opinions stated by the author or any other person named in this article are for informational purposes only and do not constitute financial, investment, or other advice. Investing in or trading crypto or stocks comes with a risk of financial loss.
Steve Anderson is an Australian crypto enthusiast. He is a specialist in management and trading for over 5 years. Steve has worked as a crypto trader, he loves learning about decentralisation, understanding the true potential of the blockchain.
 thecoinrepublic.com
