- 1 CRV price persists in forming the higher highs pattern and is close to the 50 day EMA.
- 2 Buyers are setting their vision to claim the upside mark of $0.8000.
CRV price persists in spreading the upward movement and resumes the buying action, displaying an uptrend on the charts. Furthermore, the price action shows buying resilience, and bulls are ruling, whereas sellers have been trapped for the past sessions. Following the crypto rally and positive global sentiments, the CRV token also participated in the crypto rally and streamed over 45% recently, witnessing the reversal from the demand zone of $0.4000.
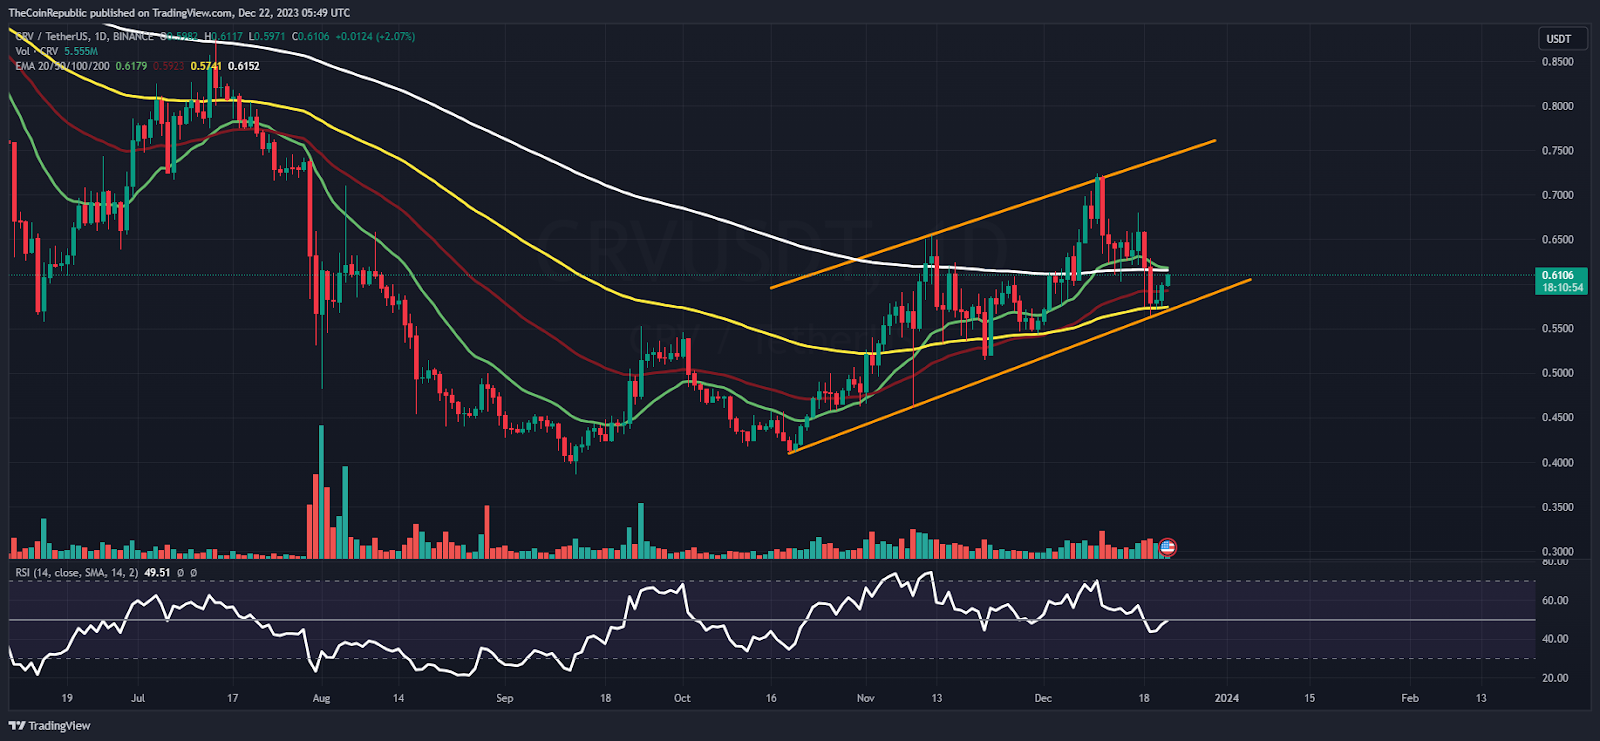
CRV price is trading close to the 100-day EMA near the channel lows and is waiting for a renewed higher high above the swing hurdle of $0.6500. Moreover, the CRV token price must escape the 200-day EMA mark to up the gains. The technicals suggest that CRV price reverted from its bottom zone and is heading to retest the neutral mark of $0.7000, which, if surpassed, CRV token will continue the bull move and will cross the further swing of $0.8000 and $0.9000 soon.
At press time, price of CRV crypto is $0.6102, with an intraday gain of 4.78%, showing neutrality on the chart. Moreover, the trading volume increased by 13.47% to $73.06 Million. However, the pair of CRV/BTC is at 0.0000138 BTC, and the market cap is $576.20 Million. Analysts have maintained a bullish rating, suggesting that the outperformance will continue in the following sessions.
CRV on Daily Chart Displays the Rising Parallel Channel

On the daily chart, CRV price glimpsed follow-on buying action, forming higher highs in the recent sessions. However, the CRV token is compressing its gains near the 100-day EMA and is waiting for a bounce above the 200-day EMA to extend the channel’s trajectory to claim the highs of $0.9000. Excluding that, the CRV token displayed a double bottom formation near $0.4000, surpassing the neckline of $0.5600.
The relative strength index (RSI) curve stayed near the midline, noted a positive divergence, and suggests that the bull run may persist in the following sessions. The MACD indicator shows a bullish crossover and green bars on the histogram, suggesting an optimistic stance for the upcoming sessions.
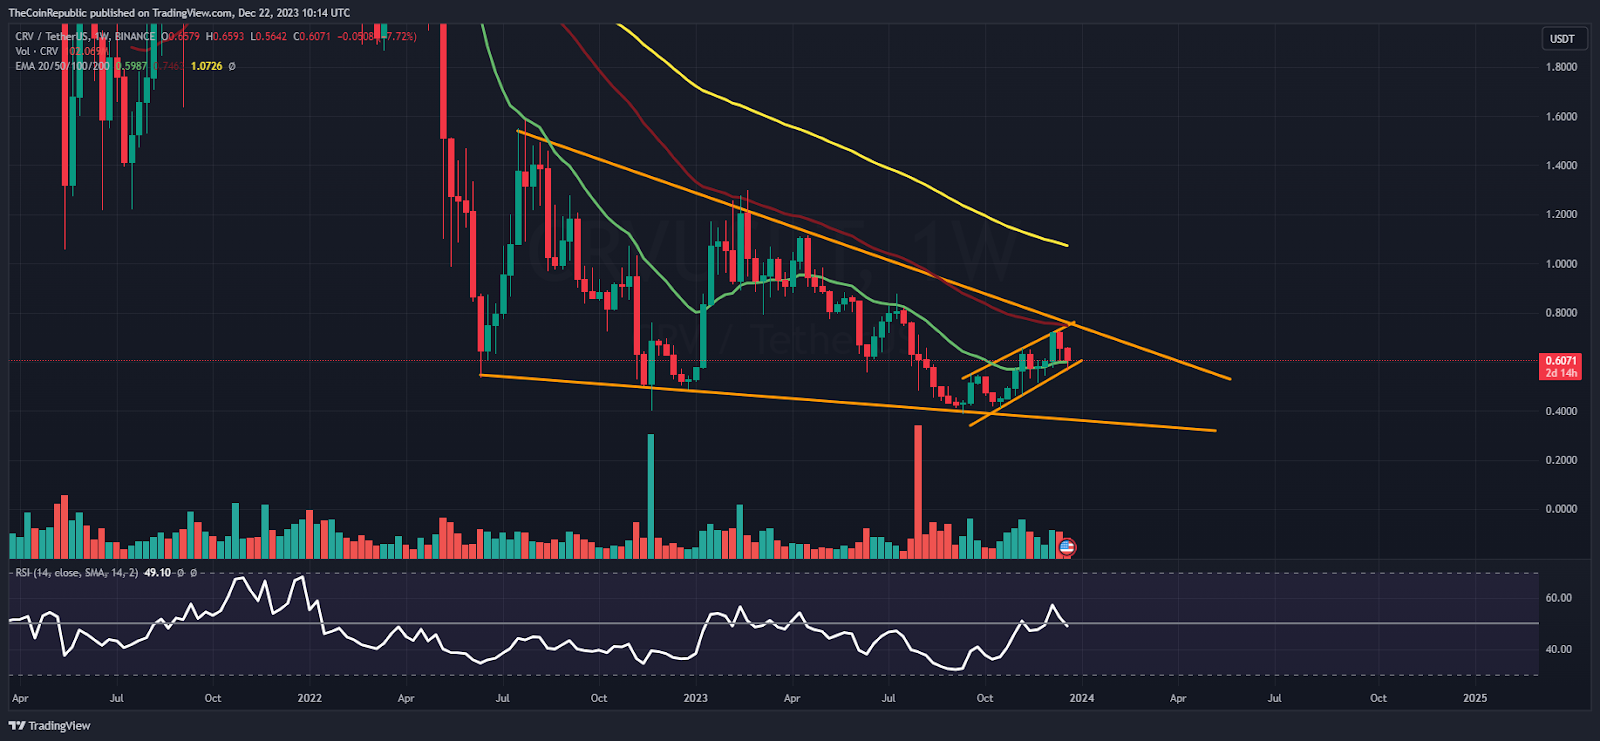
Weekly Charts Displays Falling Wedge Pattern

On the weekly chart, the CRV price has been recast from the lower neckline of the falling wedge pattern. It reveals a u-turn inside the rising parallel channel noted buyers’ accumulation. Furthermore, the price action displayed the fresh buying momentum that had developed, and trading volume also rushed daily, pointing to the investors’ interest in tweaking the CRV token beyond the bars.
Summary
CRV price portrayed a trend reversal from the demand zone of $0.4000, and is heading for the resistance zone of $0.7500. Furthermore, the CRV token price met the trendline hurdle of the falling wedge pattern and formed a rejection candlestick, highlighting the sellers’ solid grip.
Technical Levels
Support Levels: $0.6000 and $0.5600
Resistance Levels: $0.6700 and $0.7500
Disclaimer
The views and opinions stated by the author or any other person named in this article are for informational purposes only and do not constitute financial, investment, or other advice. Investing in or trading crypto or stocks comes with a risk of financial loss.
Nancy J. Allen is a crypto enthusiast, with a major in macroeconomics and minor in business statistics. She believes that cryptocurrencies inspire people to be their own banks, and step aside from traditional monetary exchange systems. She is also intrigued by blockchain technology and its functioning. She frequently researches, and posts content on the top altcoins, their theoretical working principles and technical price predictions.
 thecoinrepublic.com
