Rising buying pressure helps ROSE coin price give a bullish breakout of the double bottom pattern in the daily chart.
Oasis Network (ROSE) is a blockchain that is privacy-focused and layer one designed to promote an open financial system and sustainable data economy that uses the Cosmos SDK. This will enable Oasis to connect to an ecosystem that is part of Cosmos (ATOM)-enabled blockchain once it launches its Inter Blockchain Communication Protocol.
Let us now move ahead to the technical analysis of the Oasis Network token.
Past Performance of ROSE
The ROSE token price faced opposition near the $0.41 mark resulting in the downfall of 25 percent to the $30 support zone. However, the support near the $0.30 zone results in the bullish reversal with a double bottom pattern formation.
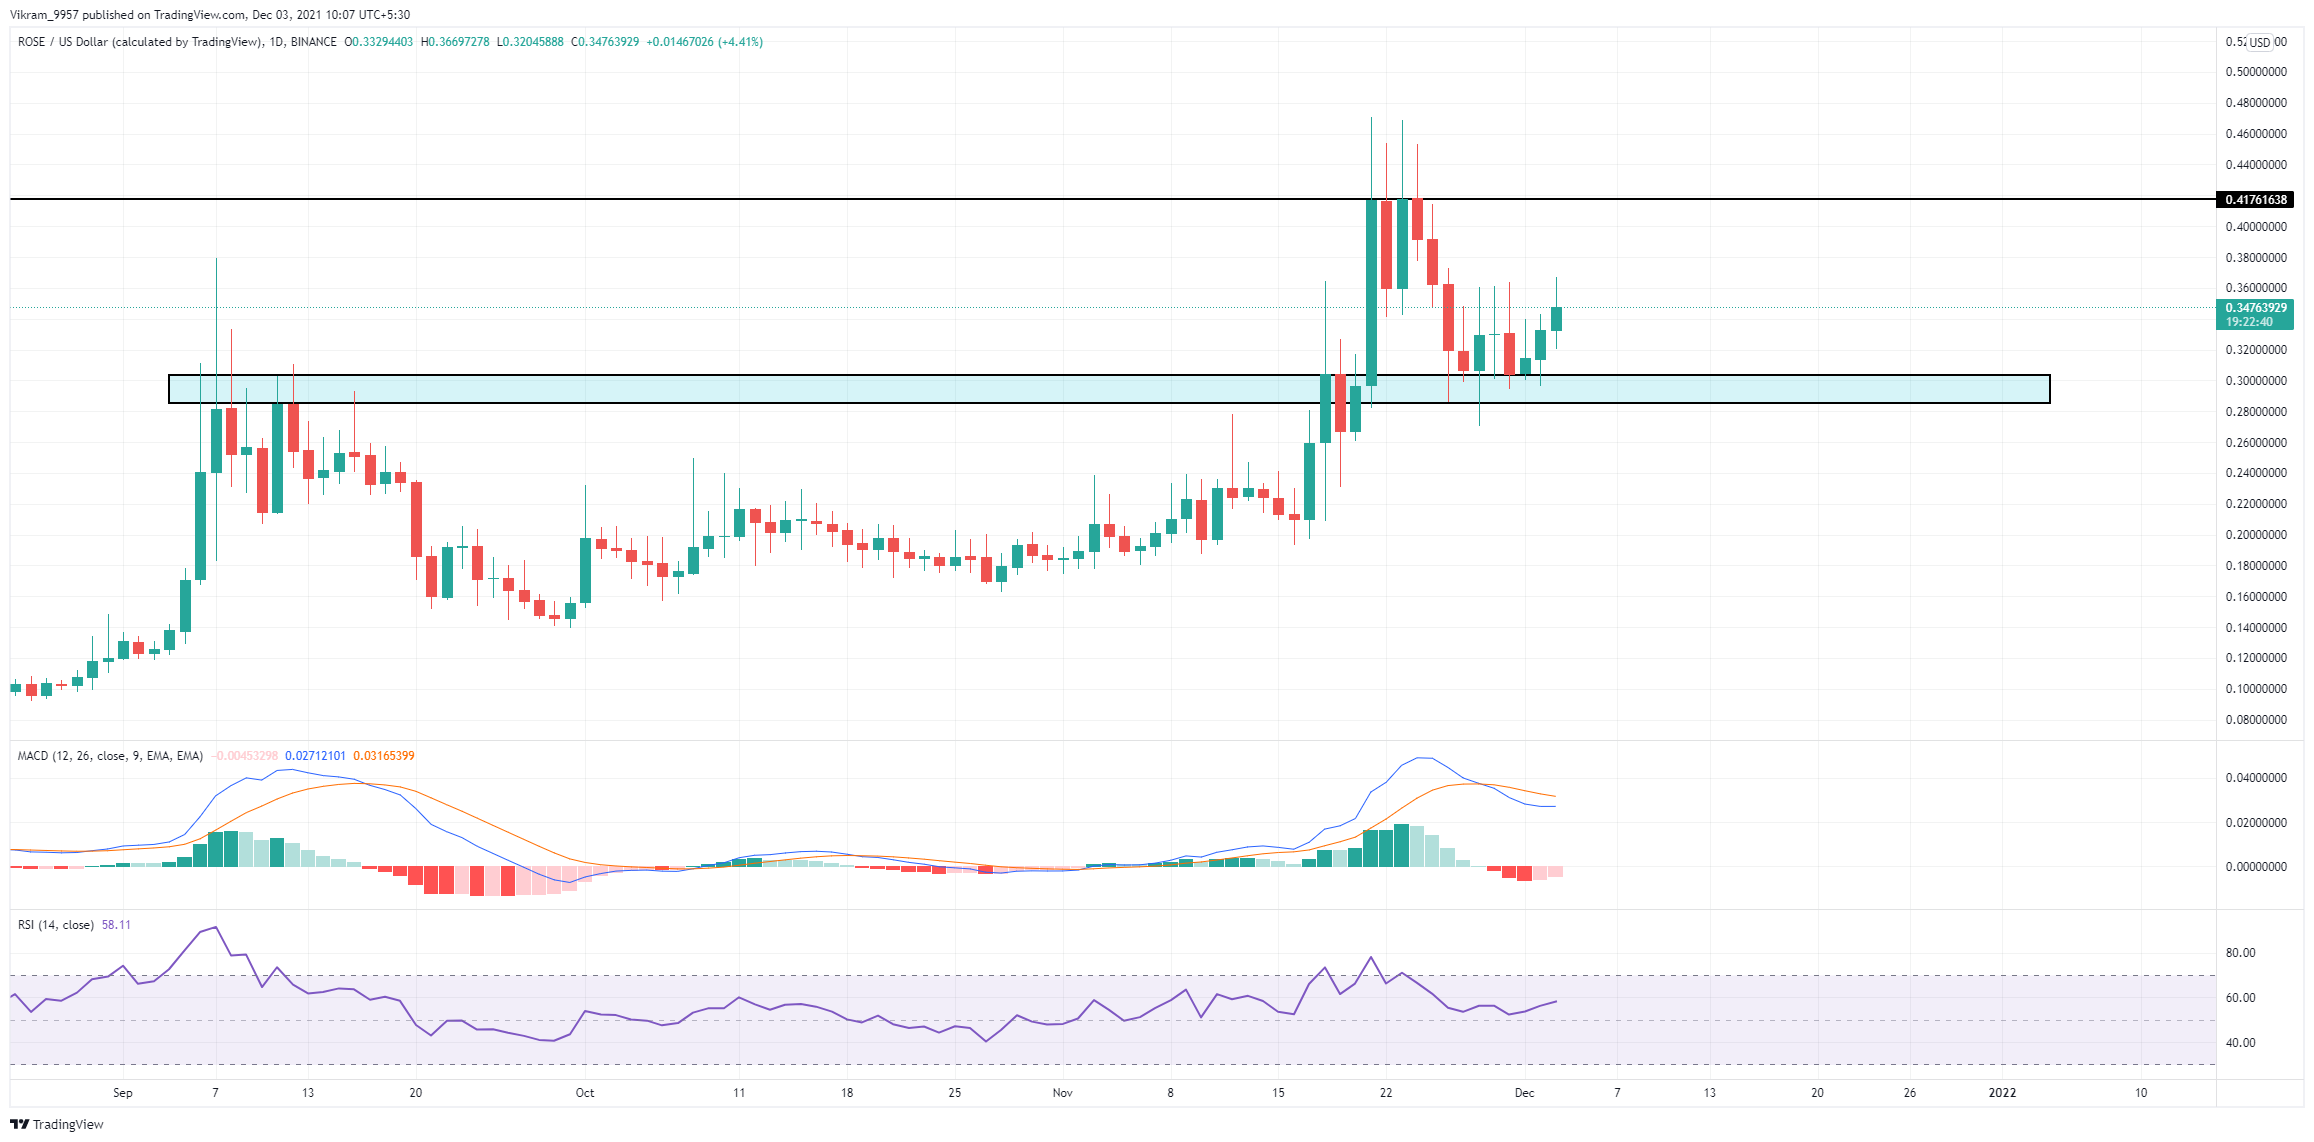
ROSE/USD Daily Chart
ROSE Technical Analysis
The ROSE coin price in the 4-hour chart shows Pivot Levels at the $0.44 and $0.55 mark that can result in a bearish reversal. And, on the opposite end, the support levels are at $0.25 and the $0.15 mark.
The RSI indicator maintains the slope crosses above the central line (50) in the daily chart. Moreover, the double bottom pattern shows a hidden bullish divergence in the slope. Hence, the indicator gives a buy signal.
The MACD and signal lines trend lower to the central mark after the bearish crossover. However, the fast line approaches the slow line indicating the chances of a bullish crossover.
Upcoming Trend
The ROSE coin price action shows a bullish reversal in the daily price chart. Hence, the breakout of the $0.35 mark, the neckline of the double bottom pattern, can be an excellent entry spot.
Moreover, the bull run can reach the $0.75 mark upon the $0.45 breakout. Hence, traders have an excellent opportunity to catch a directional move.