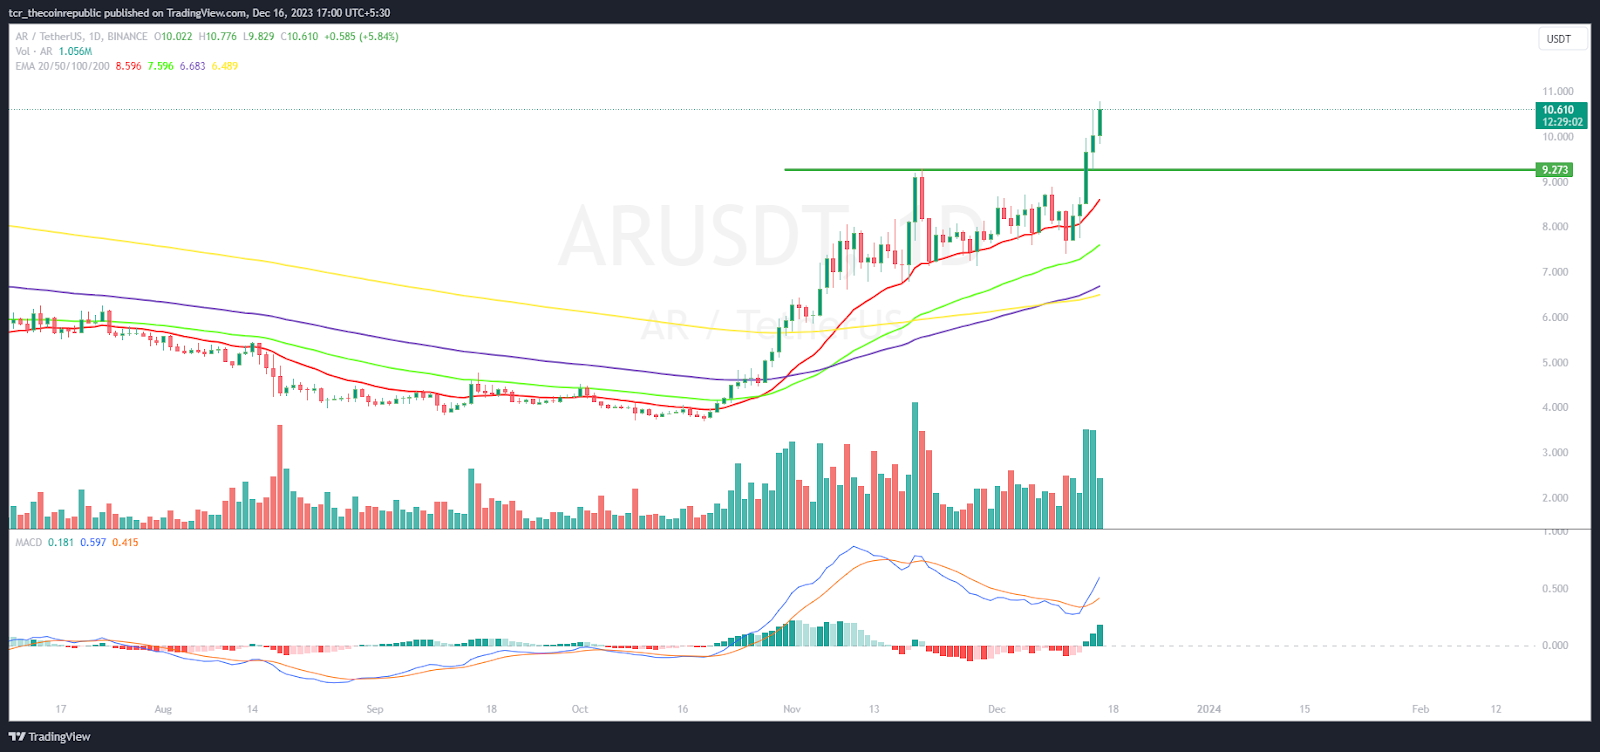
- 1 AR price chart shows a massive surge, surpassing the swing hurdle of $10.
- 2 Buyers have gained momentum and are looking to extend the rally.
Arweave price is moving with massive bullish momentum and highlighted follow-on buying action post-breakout of the swing hurdle of $9.50. Besides, the AR crypto has gained momentum and is keen to reach the $12 mark in the short term. The price action noted the buyers’ accumulation, and the trading volume spurt showcased investor interest in AR crypto. Per the ongoing trend, Arweave crypto broke out, showing strong performance on the chart. From the past sessions, Arweave price was in an uptrend and continued to form higher highs highlighting bullishness.
Arweave price surpassed the key moving averages and smartly rallied from the 20-day EMA. The technicals suggest that buying momentum will persist, and that AR crypto may reach the $12 mark, followed by $15 in the following sessions. Per the Fibonacci retracement zone, the Arweave price has surpassed the 61.8% fib levels, showing a breakout on the chart.
The live price of Arweave crypto is $10.70, with an intraday gain of 5.68%, showing neutrality on the chart. Moreover, the trading volume increased by 9.12% to 84.51 Million. However, the pair of AR/BTC is at 0.000255 BTC, and the market cap is $469.15 Million. Analysts have maintained a neutral rating and suggest a growth outlook for the upcoming sessions.
Arweave Price Displays Range Breakout on Daily Chart

On the daily chart, Arweave price has pictured an upward movement, and bulls are bringing ahead the progress to retest the make-or-break swing of $15. Moreover, the price action exhibited fresh higher high rows and ascertained a range breakout, which led sellers to snare. Per the technicals, Arweave price will resume to spray gains and resume the buying action.
The RSI curve stayed in the overbought zone and demonstrated a positive crossover, suggesting that outperformance will continue and AR crypto may move bullishly. The MACD indicator shows a bullish crossover and green bars on the histogram, offering a positive outlook for the upcoming sessions.
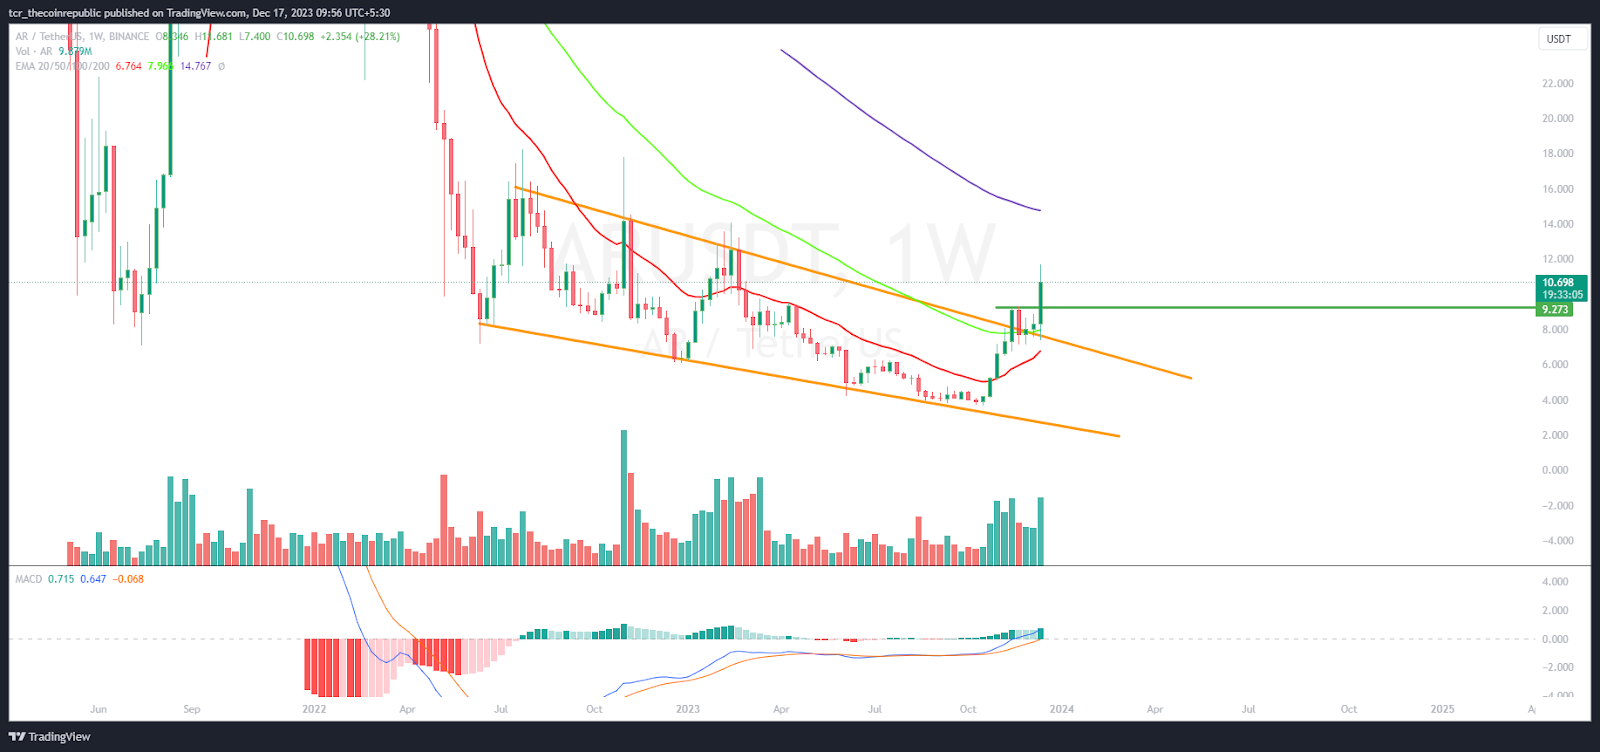
Arweave on Weekly Chart Shows a Breakout From the Falling Channel

On the weekly chart, Arweave crypto broke the trend and is heading for the swing mark of $15. Moreover, the chart displayed the falling channel breakout and witnessed fresh buying momentum.
Summary
Arweave price replicated a range breakout and displayed a huge bullish candlestick above the prompt hurdle of $10. Moreover, the ongoing trend shows that buyers have acquired strength and are eyeing the round mark of $15.
Technical Levels
Support Levels: $9.30 and $8.50
Resistance Levels: $12 and $15
Disclaimer
The views and opinions stated by the author or any other person named in this article are for informational purposes only and do not constitute financial, investment, or other advice. Investing in or trading crypto or stocks comes with a risk of financial loss.
Steefan George is a crypto and blockchain enthusiast, with a remarkable grasp on market and technology. Having a graduate degree in computer science and an MBA in BFSI, he is an excellent technology writer at The Coin Republic. He is passionate about getting a billion of the human population onto Web3. His principle is to write like “explaining to a 6-year old”, so that a layman can learn the potential of, and get benefitted from this revolutionary technology.
 thecoinrepublic.com
