- 1 HBAR price prediction suggests the rally has just begun and more scope for upside is open.
- 2 The Hedera price jumped 13% in the current week and is racing toward the YTD high.
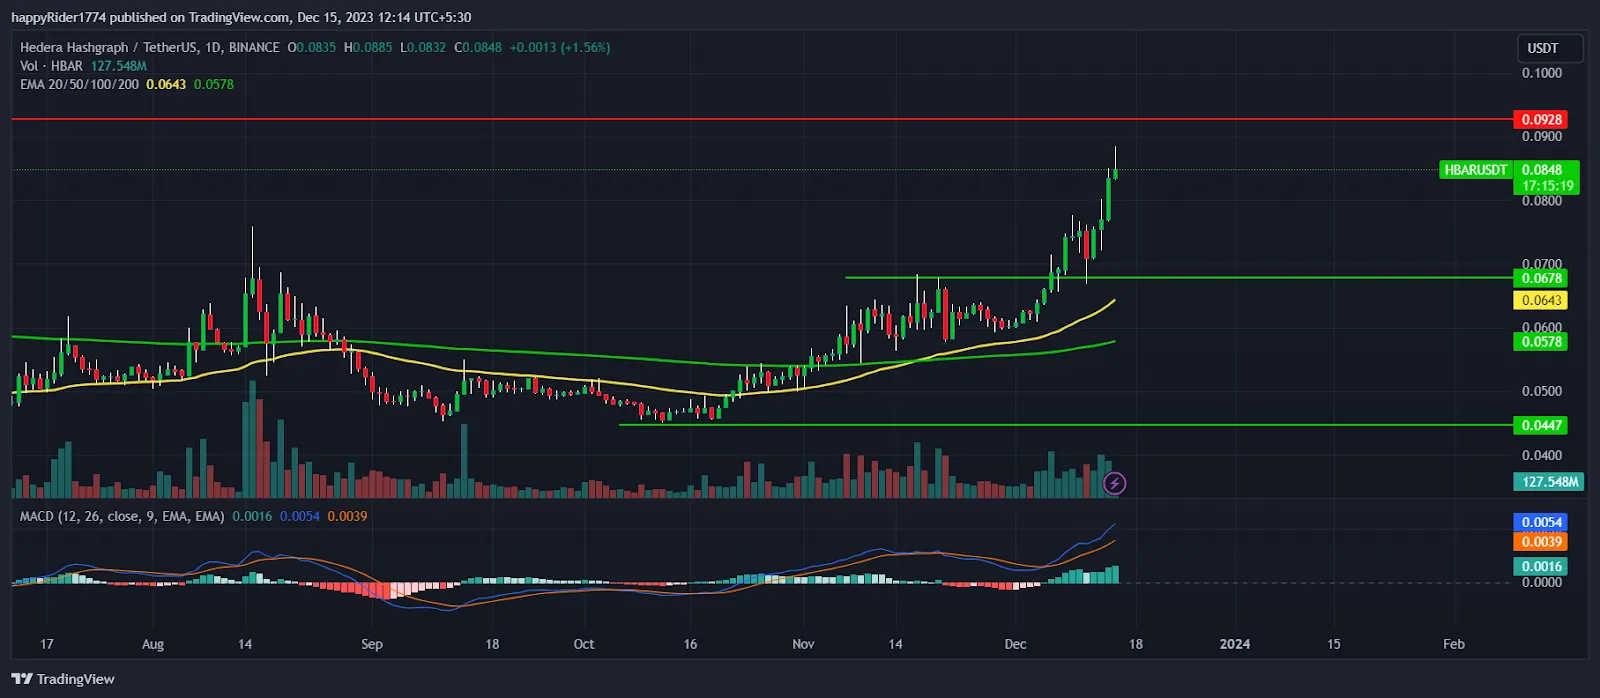
- 3 The EMAs in HBAR crypto displayed a golden crossover.
HBAR price prediction favors the bulls and suggests the rally might continue for a few more months.
Hedera formed a double bottom pattern on the higher time frame chart and buyers succeeded in breaking out of the neckline hurdle. The recent breakout in Hedera price is supported by a decent volume, so it increased the possibility of sustaining higher levels.
The 50-day EMA positively intersected with the 200-day EMA and displayed a golden crossover. It boosted the confidence of the existing investors and fueled the upward momentum.
The HBAR crypto price jumped 13% in the current week and positive momentum is still intact. The bulls look more aggressive as compared to bears so more upward momentum is possible.
The Hedera price is sustaining above the 50-day and 200-day EMAs, showcasing that the trend is in an upward direction.
At present, the HBAR price is racing toward the supply zone of $0.0928. So, it will be interesting to see whether the bulls win the battle in the supply zone or not. If they succeed, it will trigger the next phase of the rally.
Currently, the Hedera price is trading at $0.0848 with an intraday uptick of 1.56%. In the last 24 hours volume to market cap stands at 5.08%.
Will HBAR Price Hit New Swing High in January?

The HBAR price performed well in the last two months and formed a highly bullish pattern. It broke out of the last five months’ swing highs and buyers are successfully holding the higher levels.
However, the Hedera coin price looks mildly overstretched and near the overbought territory so minor correction or narrow range consolidation is possible. In the coming months, if the price holds the $0.0800 level then the probability of hitting new swing highs will increase.
The analysis suggests HBAR crypto price is in the bulls’ grip so the rally might continue in January 2024.
Will Hedera Price Break the YTD High?
Hedera price rose for nine consecutive weeks and recovered the losses of the past ten months. The price is racing toward the YTD high placed at the $0.0988 level. If the momentum continues and buyers succeed in taking control of the supply zone then 10% to 20% more upside will open.
The MACD curve is sloping upward and the histogram bar is forming green bars. It indicates that the bullish momentum might continue. Whereas, the RSI at 77 denotes overbought territory which is a matter of concern for the bullish traders.
Conclusion
HBAR price prediction stays bullish for January 2024 and suggests bulls will continue their dominance.
Hedera price showed a surprising recovery from lows, which is supported by decent buying volume. Therefore, it shows the participation of big investors who are expecting the price may perform well in the coming months.
Technical levels
- Resistance levels: $0.0928 and $0.0988
- Support levels: $0.0678 and $0.0658
Disclaimer
The views and opinions stated by the author, or any people named in this article, are for informational purposes only. They do not establish financial, investment, or other advice. Investing in or trading crypto assets comes with a risk of financial loss.
Bamidele Sodeeq is an experienced writer and journalist with three years of expertise in the field. He has contributed to renowned publications such as oobit, playtoearndiary, and Dapp playstore. Sodeeq specializes in crafting captivating content covering topics like cryptocurrency, blockchain, and FinTech.
His work has gained recognition and has been featured on various platforms. Apart from writing, Sodeeq also enjoys watching football matches.
Connect with Bamidele Sodeeq on LinkedIn for updates on his latest ventures.
 thecoinrepublic.com
