- 1 MINA price prediction says this coin might show a significant rise in its value in the coming months.
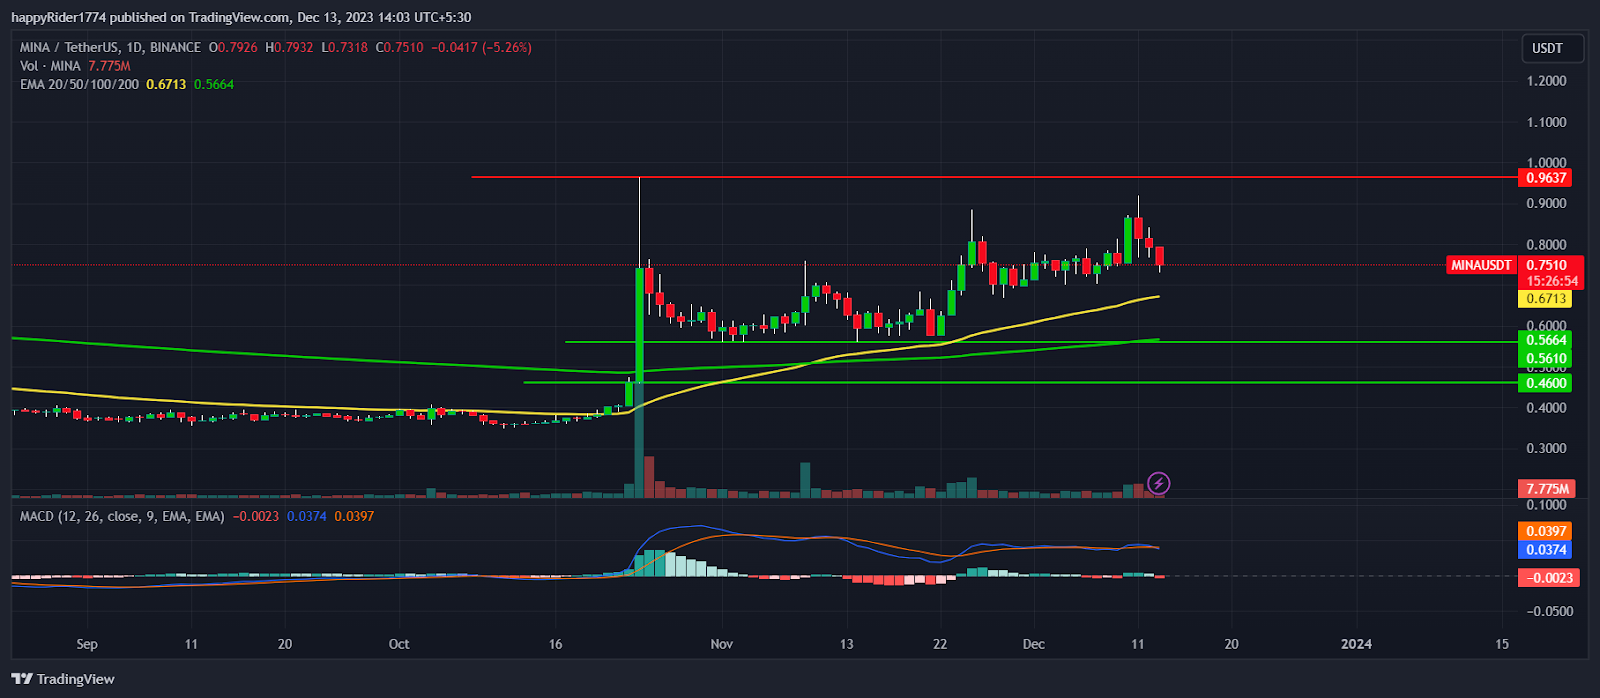
- 2 The Mina crypto sustained above both 50-day and 200-day EMAs, which showcases an uptrend.
- 3 The EMAs in the MINA coin displayed a golden crossover.
The MINA price prediction suggests a significant rise in its value is possible in the coming months. It is forming a mildly bullish pattern and buyers are trying their best to push the price above the $1.00 mark.
The 50-day and 200-day EMAs are sloping upward, showcasing uptrend. Moreover, the EMAs displayed a golden crossover which triggered the positive sentiment and boosted the confidence of the investors.
Recently, the MINA price attempted to break out of the $0.9000 hurdle to reach the $1.00 mark. Sadly, the sellers were active and the price faced sharp rejection. The price later reversed down and retraced back to the 50-day EMA.
The chart pattern looks mildly bullish and the probability of bouncing back from the 50-day EMA remains high. The trading volume is constant and volatility in the Mina coin is quite low. It shows the lack of participation of the big players.
The price action favors bulls but it needs fresh buying and participation of crypto whales to break out of the $1.00 mark. Currently, the MINA price is trading at $0.7510 with a one-day decrease of -5.26%. In the last 24 hours, volume to market cap stands at 9.60%.
MINA Price Analysis: Will the $1.00 Breakout Trigger Rally?

The MINA price prediction stays bullish for the long term and suggests a massive breakout may be visible. It has formed a strong base near $0.5000 level. So any short-term correction toward the support may get easily absorbed by the buyers.
Until the Mina coin sustains above the $0.5610 level, the buyers will remain active and try their best to protect the demand zone.
On the higher side, $1.00 is acting as a strong hurdle for bulls. If buyers succeed in breaking this hurdle and sustain, the next phase of the rally may trigger.
What If the Sell Off Continues in Mina Crypto?
The Mina token price fell 13% in the current week and formed a bearish candle on the weekly chart. If the sell-off continues and the price slips below the $0.5610 level, it may raise concerns for its long-term investors.
The MACD curve sloping sideways denotes price may consolidate for some time in range. The RSI at 52 denotes neutral territory and an equal level of tug-of-war between buyers and sellers.
Conclusion
The MINA price prediction favors the bulls and suggests a rise in the long run. The buyers look active near the demand zone. So, if the price retests the demand zone, it may show a sharp bounce.
The analysis suggests if the MINA crypto gives a breakout of $1.00, a 20% to 30% rally is possible in a short period.
Technical levels
- Resistance levels: $0.9637 and $0.1300
- Support levels: $0.5664 and $0.4600
Disclaimer
The views and opinions stated by the author, or any people named in this article, are for informational purposes only. They do not establish financial, investment, or other advice. Investing in or trading crypto assets comes with a risk of financial loss.
Andrew is a blockchain developer who developed his interest in cryptocurrencies while pursuing his post-graduation major in blockchain development. He is a keen observer of details and shares his passion for writing, along with coding. His backend knowledge about blockchain helps him give a unique perspective to his writing skills, and a reliable craft at explaining the concepts such as blockchain programming, languages and token minting. He also frequently shares technical details and performance indicators of ICOs and IDOs.
 thecoinrepublic.com
