- Terra price analysis is bullish today as the coin has hit a record high.
- The price is now touching the $57 level.
- The previous ATH at $54 now turns into a support level for LUNA.
The Terra price analysis reveals the coin has broken through to a record high today, as the price broke above $54 and is now trading above $57. The LUNA/USD has been bullish for the last four days, as the coin has been on an upwards trend since then, gaining significant value, and today it rallied high, and another all-time high price is being observed.
LUNA/USD 1-day price chart: Bullish momentum takes LUNA to a $57 record high
The 1-day price chart for Terra price analysis shows that the coin raced high above the previous ATH of $54 as it is trading hands at $57.4 at the time of writing. The LUNA/USD pair reports an increase in value by 8.9 percent over the last 24 hours and also an increase in value by 36.2 percent over the course of the past seven days. The market cap has improved by 11.6 percent, and the trading volume has increased by 35.4 percent.
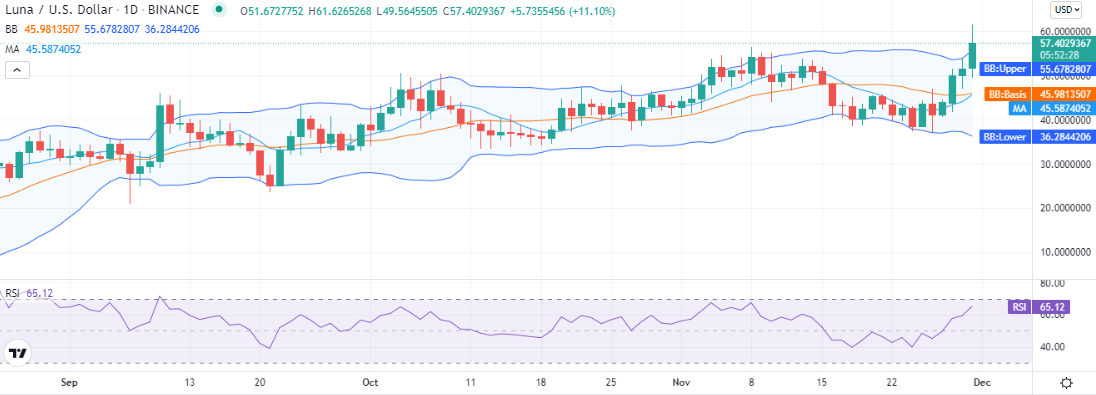
The volatility has been increasing for the crypto pair as the Bollinger bands started to expand yesterday, and the divergence continues today as well, with the upper band at $55.6 representing support for the LUNA/USD pair. The moving average (MA) is present at the $45.5 mark.
The LUNA/USD pair is nearing the overbought state as the relative strength index (RSI) continues to trade on an upwards curve at index 65. But the RSI still shows some more room for bullish activity.
Terra price analysis: Recent developments and further technical indications
The 4-hour Terra price analysis shows that the price breakout was downwards today, but after correcting for four hours, bulls took over the price function, and the price started oscillating fast upwards, breaking out to a record high of $57.4, but as the last candlestick on the 4-hour chart is red, so bulls might need some rest, before rallying further high, or maybe bears took over again.
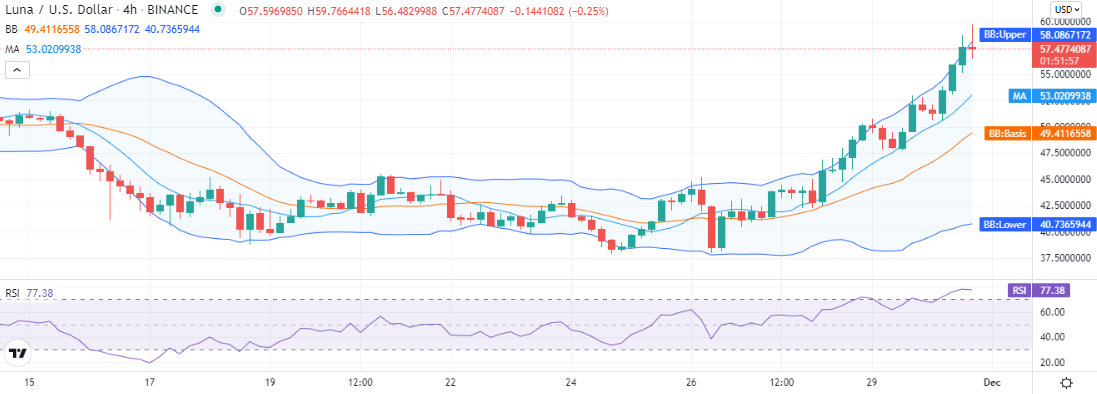
The volatility on the 4-hour chart is quite high as the volatility indicator covers a larger area, with the price trading just below the upper limit of the indicator. The RSI continues to trade in the overbought zone on a straight line, indicating the weakness of buyers’ strength.
As the trend has been upwards for the past few days, the technical indicators for Terra price analysis are also supporting the bullish side, with 17 indicators showing buy signs and only one indicator showing a sell sign. The remaining eight technical indicators stand neutral and don’t show support for either side, out of a total of 26 technical indicators.
Terra price analysis conclusion
The Terra price analysis shows that the crypto pair is highly bullish at this moment in time, with the highest spike in price observed today. Prospects are brighter for LUNA as it broke out to a new all-time high today. However, cautious trading is advised beyond this point as the price is already at a quite higher level, and a correction may start any time, as the 4-hour price chart indicates as well.
Disclaimer. The information provided is not trading advice. Cryptopolitan.com holds no liability for any investments made based on the information provided on this page. We strongly recommend independent research and/or consultation with a qualified professional before making any investment decisions.