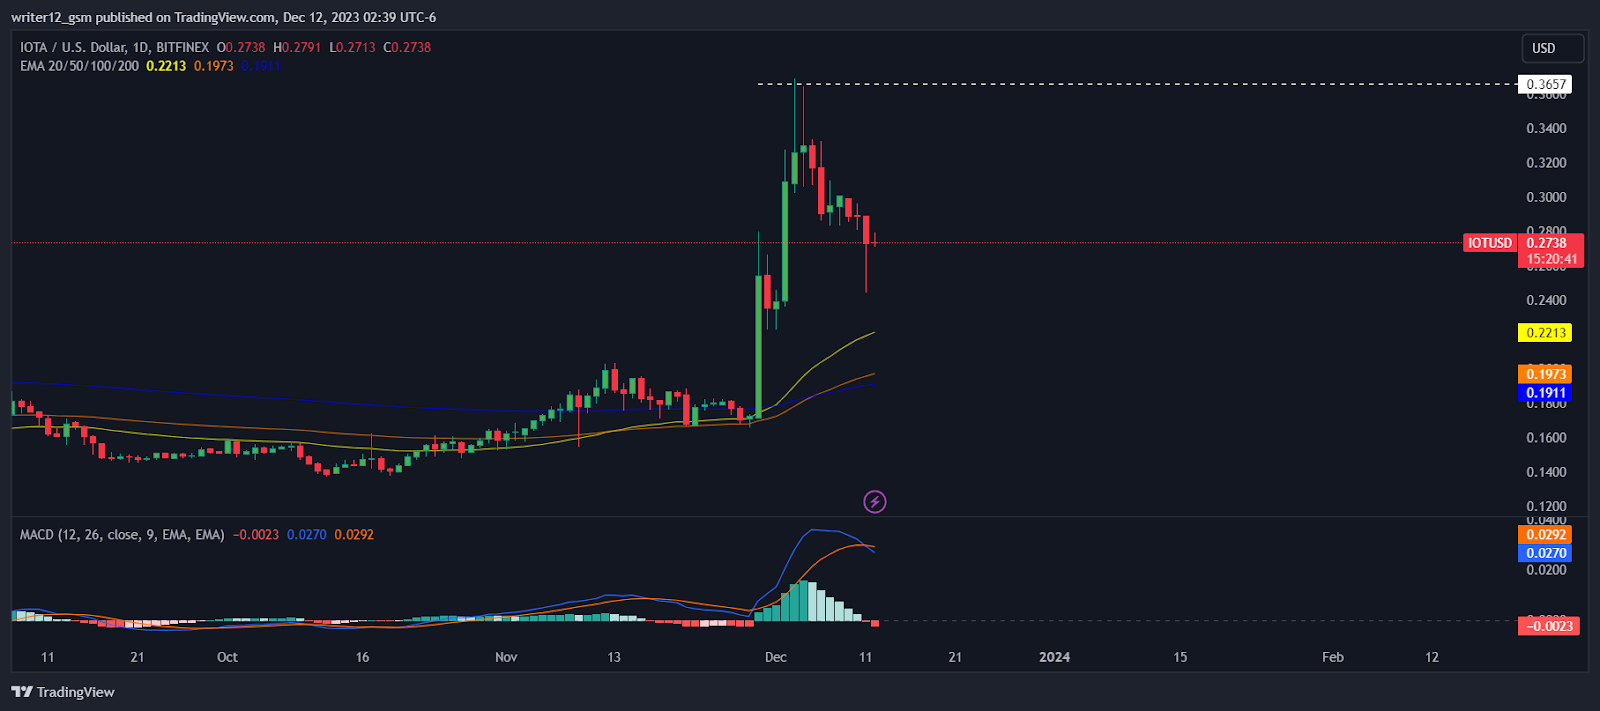
- 1 IOTA crypto price dropped by 17.08% in the last seven days.
- 2 IOT crypto is trading above the key moving averages highlighting strength.
IOTA crypto price has been falling over the past few weeks, as it met resistance from the upper levels and made lower highs. This indicates that the bears have been dominant and the crypto has lost speed. However, crypto is still above the key moving averages.
The crypto has formed a bearish pattern and wiped out the profits it gained last month. IOTA (USD: IOT) crypto has gone back to its previous 200-EMA level, which could serve as a support. The technical analysis suggests that the crypto is oversold and could recover from the lower levels. However, the crypto needs to show some signs of power and reversal before validating a pullback rally.
IOTA crypto (USD: IOT) price is in a correction phase but trading close to vital support of $0.2213. If formed, a bearish candle shows buyers are active and will do their best to bounce back. IOT crypto price ended the previous session at $0.2738 with a daily rise of 0.18%. If the buyers manage to protect the current support, then the chance of a bounce back will rise. However, if the sell-off goes on and IOTA crypto falls below lower levels, more drop is likely.
Buyers attempted several times to break the upper range and move upward. However, due to the strong presence of sellers, prices faced rejection. It shows sellers are still active on upper levels.
Technical Analysis of IOTA Crypto Price in 1-D Time Frame

IOTA price is trading over the 50-day and 200-day EMAs, highlighting the power. But, the IOTA price is far above the EMAs. The MACD made a negative crossover and the histogram is also red implying slight bearishness. The RSI at 58 shows weakness but is close to the overbought area.
The RSI value is 58.25 points. The 14 SMA is over the middle line at 69.88 points which shows that the IOTA crypto is bearish.
Weekly-Time Horizon Analysis

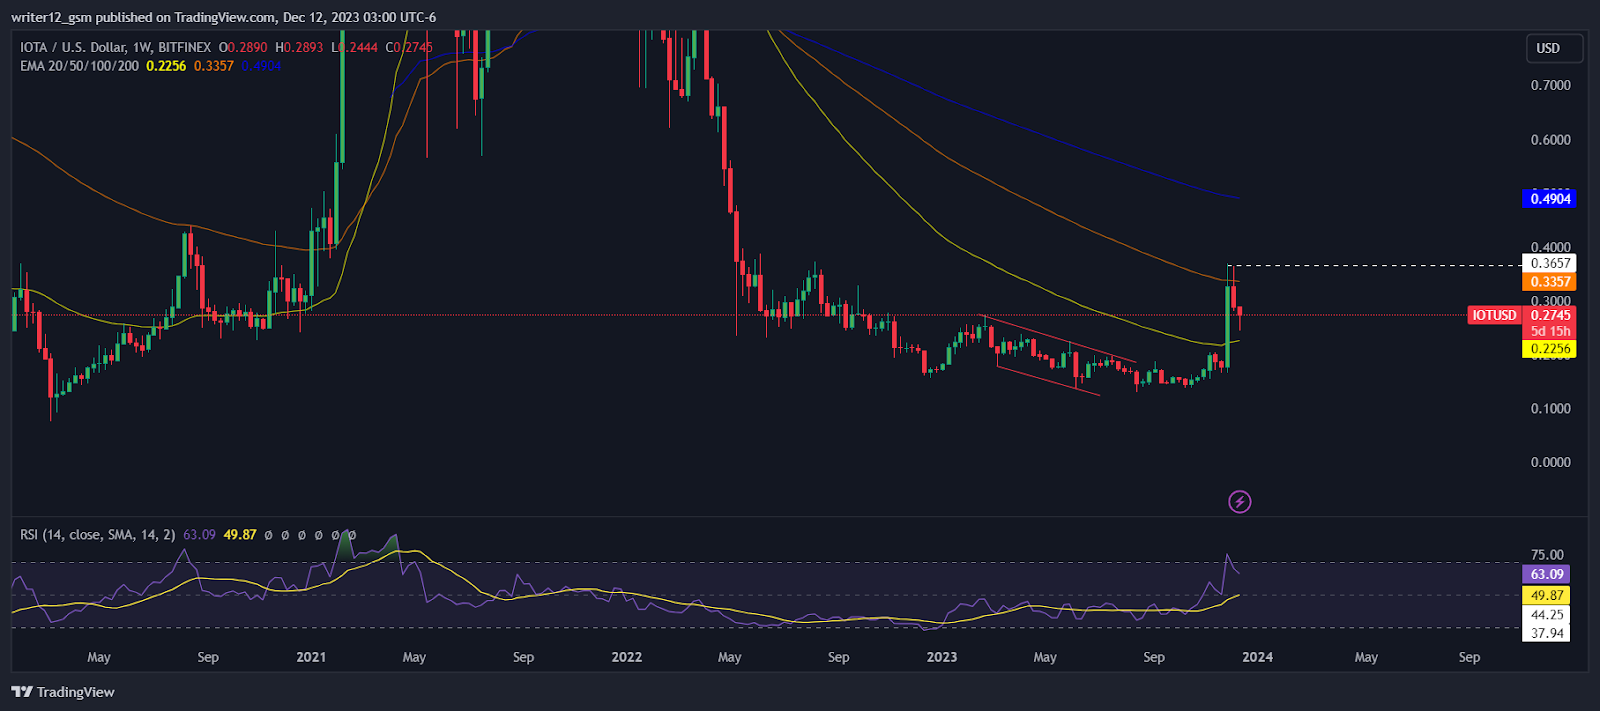
IOTA crypto displayed sellers’ power on the weekly chart. Also, the price moved below the key EMAs, which indicates more decline in the crypto. The RSI curve is close to the oversold area at 62, and a pessimistic view was seen, implying bearishness in the crypto. The MACD indicator also continued to form red bars, and a bearish crossover was seen, which suggests corrective actions.
Summary
IOTA crypto (USD: IOT) is showing signs of weakness as it trades below the resistance levels and forms lower highs. The crypto has the potential to bounce back from the support levels of $0.2213 and $0.2000, if the buying volume increases. However, the crypto also faces the risk of falling below the support levels and losing momentum if the selling pressure mounts. The RSI and MACD indicators are bearish to neutral, suggesting a cautious approach for the traders.
Technical Levels
Support Levels: $0.2213 and $0.1973
Resistance Levels: $0.3017 and $0.3657.
Disclaimer
This article is for informational purposes only and does not provide any financial, investment, or other advice. The author or any people mentioned in this article are not responsible for any financial loss that may occur from investing in or trading. Please do your own research before making any financial decisions.
Amanda Shinoy is one of the few women in the space invested knee-deep in crypto. An advocate for increasing the presence of women in crypto, she is known for her accurate technical analysis and price prediction of cryptocurrencies. Readers are often waiting for her opinion about the next rally. She is a finance expert with an MBA in finance. Quitting a corporate job at a leading financial institution, she now engages herself full-time into financial education for the general public.
 thecoinrepublic.com
