- 1 The Uniswap crypto price is currently trading at $6.26 with a drop of 4.58% in the last 24 hours
- 2 It has a current market cap of $3.686 Billion and is trading above the key moving averages showing strength on the charts
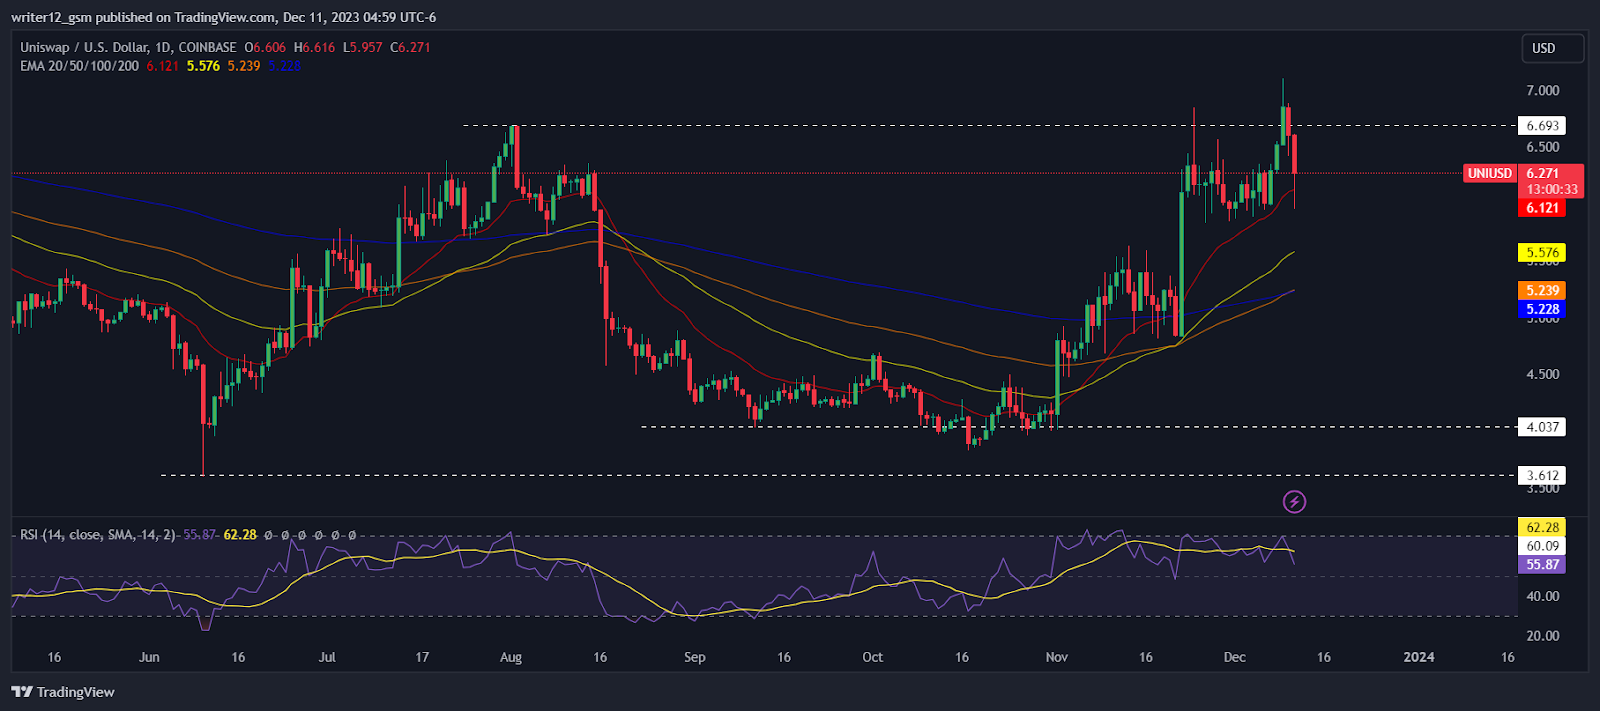
The Uniswap coin price has been trending upward in the last session. It has maintained an upward trend above its 200-day EMA near the $7.60 cluster in the bullish zone. The chart shows the current bullish momentum.
Moreover, the price action is favorable for buyers and the charts show continued growth activity. Uniswap coin’s price is on an upward trajectory towards $7.00. If it exceeds that level, it will return to the high of $10.00. Conversely, the lower trajectory is near $6.000, a breakdown of which will take the price back to the 200-day EMA near $5.50.
At press time, the UNI token was bearish, down 4.58% intraday and trading at $6.26. Moreover, the 24-hour trading volume is $3.686 Billion. However, the market capitalization of UNI is $3.686 Billion.
The UNIUSD performance throughout the year was decent. It has given a return of 21.40% for the year to date, 46.05% for the previous 6 months, 18.59% for the last month, and 3.42% for the past week. That indicates a continuing bullish momentum that has not yet been changed.
Technical Analysis of Uniswap Crypto Price in 1-D Timeframe

The Uniswap (USD: UNI) cryptocurrency is currently trading above its 50-day and 200-day exponential moving averages (EMA), which support its price momentum. The current RSI value is 62.26 points. The 14 SMA is above the center line at 62.26 points, indicating the bullish nature of the Uniswap cryptocurrency. The MACD line at 0.309 and the signal line at 0.319 are above the zero line. There is a bearish crossover in the MACD indicator, which indicates weak momentum in the price of the UNI cryptocurrency.
Short-term price analysis

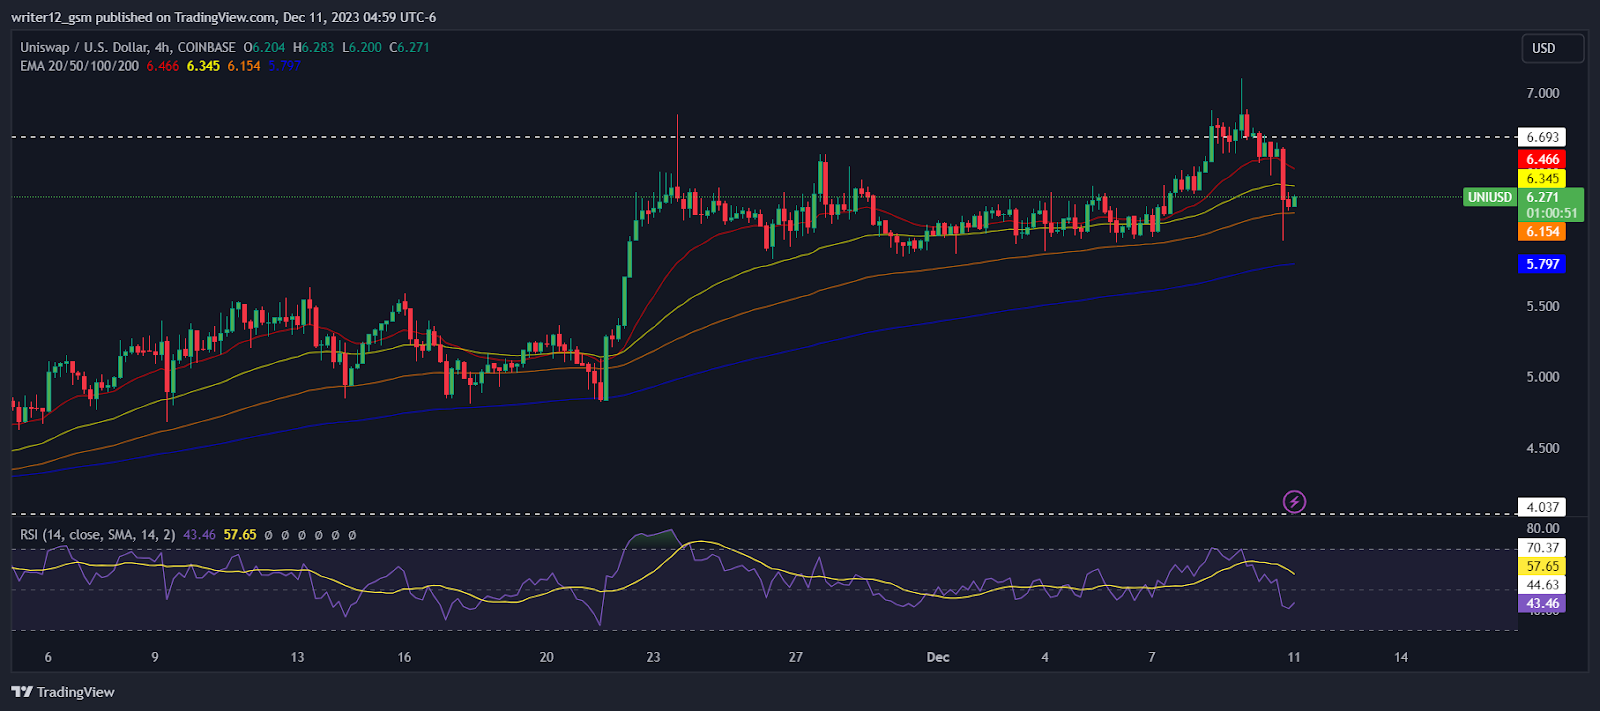
The Uniswap token price is bearish and taking support on the 100 EMA. However, the trend is strong and buyers are trying to break the zone and hold above $6.000. The RSI curve is around 43, which is close to the neutral level. The token price consolidation is forming a negative crossover, which contributes to the negative outlook on the chart. The MACD indicator has shown a bearish crossover, but the red bar is close to the end. It indicates that a crossover is imminent. However, the price can be consolidated.
Summary
Uniswap is one of the most famous decentralized exchange platforms in the market, as it permits users to trade any ERC-20 tokens without mediators. Its native token “UNI” has shown a robust comeback from its lows. It is now trading above essential resistance levels. The technical breakdown of the daily and 4-hour charts suggests that the cryptocurrency is in a bullish trend and has the potential to reach the $10 mark in 2023. Therefore, investors and traders can expect a positive return from the UNI crypto in the long term.
Technical Levels
Support Levels: $5.796.
Resistance Levels: $7.000.
Disclaimer
This article is for informational purposes only and provides no financial, investment, or other advice. The author or any people mentioned in this article are not responsible for any financial loss that may occur from investing in or trading. Please do your research before making any financial decisions
Steve Anderson is an Australian crypto enthusiast. He is a specialist in management and trading for over 5 years. Steve has worked as a crypto trader, he loves learning about decentralisation, understanding the true potential of the blockchain.
 thecoinrepublic.com