- The Dogecoin price analysis is bearish.
- Resistance is found at $0.209.
- Support is present at $0.203.
The Dogecoin price analysis is bearish today. After the 26th November flash crash and hitting November’s low, DOGE recovered slowly for two days and again faced rejection at $0.207 today, which is already a quite lower price level for DOGE/USD. Overall, DOGE is on the decline from 29th October and has not been able to break out of the bearish cycle.
The broader cryptocurrency market has been bullish for the last 24 hours, along with Bitcoin and many altcoin‘s turning green reporting handsome profits. However, many coins are observing a reversal today, and even Bitcoin, after swinging high, has reverted back to some degree which may also turn negative in the coming hours.
DOGE/USD 1-day price chart: DOGE needs to consolidate to stop further downside
The 1-day Dogecoin price analysis shows the coin has covered a downwards range today again after recovering a little for the last two days, but the recovery was not sufficient enough to change the trend, and the coin continued downside today again. Doge has not been able to enter consolidation as the market sentiment continues to be negative. DOGE/USD is trading hands at $0.205 at the time of writing.
However, due to the positive price function for the last two days, the coin reports a 2.89 percent increase in value over the last 24 hours, the only reason being the last spike in price just four hours ago. The real picture is that the coin has lost 7.86 percent over the last week. The trading volume has also turned down by a little more than four percent.
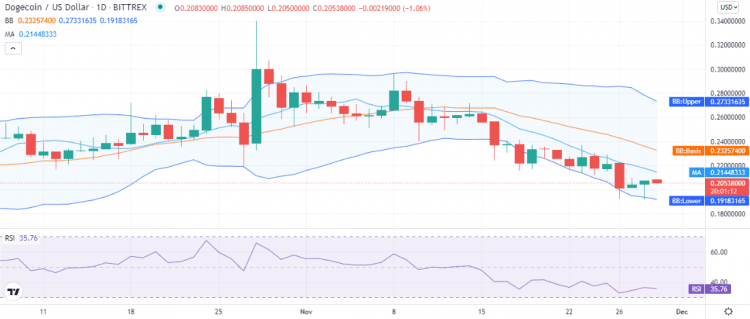
The volatility is high for DOGE, with the Bollinger bands covering more area, the upper band is present at the $0.273 mark, and the lower band is at the $0.191 mark representing a support zone for DOGE. The mean average of the indicator at $0.232 represents the resistance zone for DOGE.
The moving average (MA) continues to trade above the price level at the $0.214 level complementing the bearish trend. The relative strength index (RSI) is also at a lower level of index 35, trading on a downwards slope indicating more selling activity in a low momentum market.
Dogecoin price analysis: Recent developments and further technical indications
The 4-hour Dogecoin price analysis shows a countable decrease in price as well. The overall trend on the 4-hour chart is also downwards, with a clear pattern of smaller steps upside followed by steep plunges on the downside; however, a high spike was observed during the last four hours of yesterday’s session, which helped in marking a green candlestick on the 1-day chart as well, indicated by a longer second last green candlestick on the 4-hour chart.
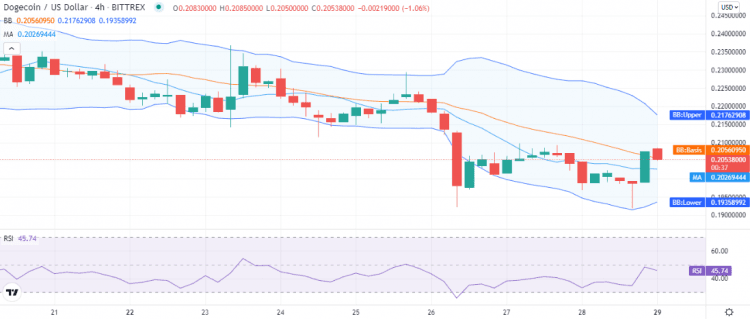
The MA here is below the price level at the $0.202 mark, and the RSI is also at a better score of 45 due to the price spike observed recently but still in the lower half of the neutral zone and again trading on a downwards slope.
Dogecoin price analysis: Conclusion
The Dogecoin price analysis concludes the DOGE has followed Bitcoin’s pattern pretty basically. If Bitcoin tanks which is already on a decline since 9th November, then all crypto follows. DOGE has spiked high whenever Bitcoin breakouts to ATH, as is obvious from May, June, and then from October bull run of DOGE, so if Bitcoin continues downside towards $48k range, then we see DOGE test $0.170 range. For intraday trading, the coin is expected to continue downside for the next 20 hours.
Disclaimer. The information provided is not trading advice. Cryptopolitan.com holds no liability for any investments made based on the information provided on this page. We strongly recommend independent research and/or consultation with a qualified professional before making any investment decisions.