- 1 Ravencoin price prediction suggests that consolidation is over and RVN crypto is getting ready for a sharp rise.
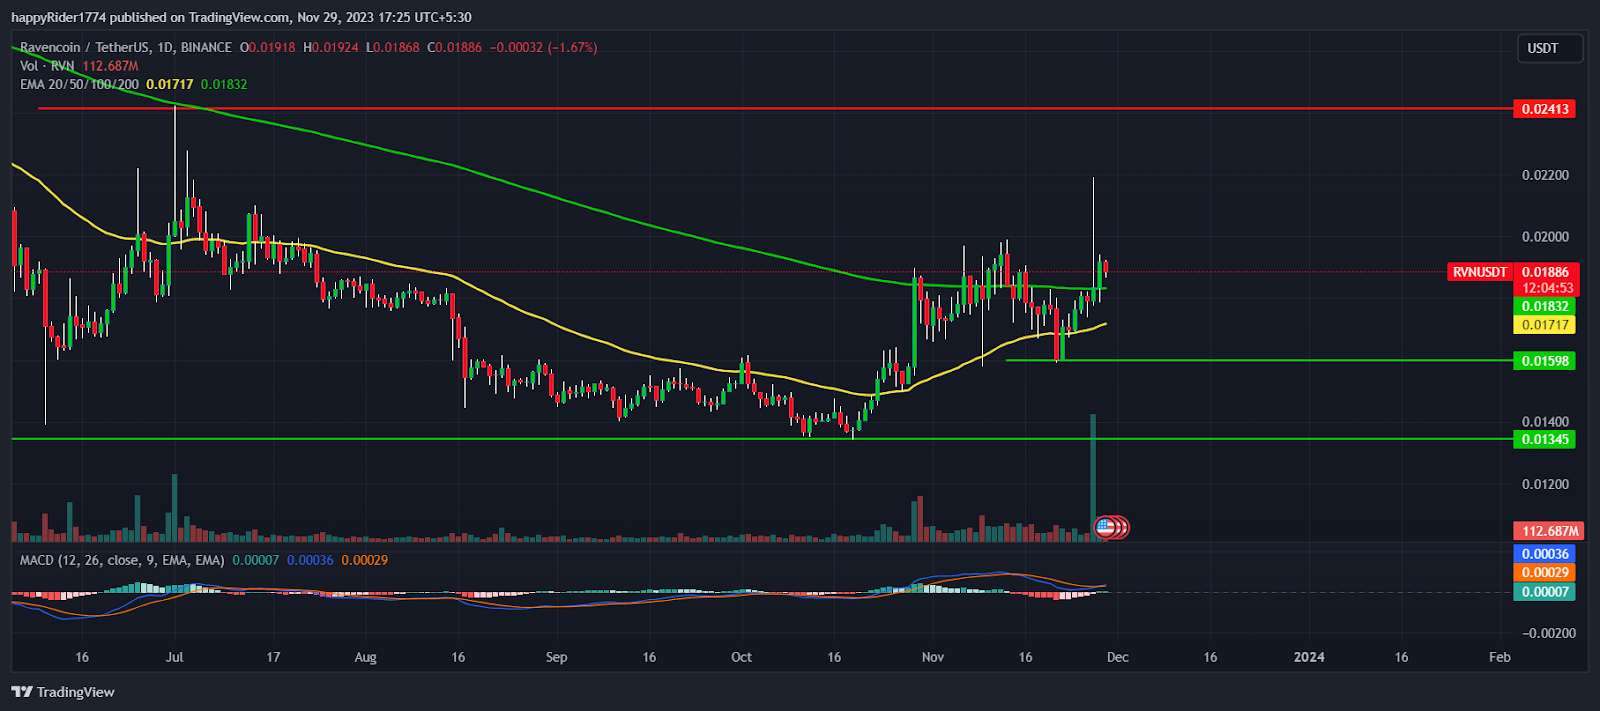
- 2 RVN price sustains above the 50-day and 200-day EMA.
- 3 The correction in Ravencoin crypto has halted and the time for reversal is here now.
Ravencoin price prediction suggests a rise in the short term as well as in the long term. The chart structure shows that the consolidation is over and anytime RVN crypto price may show a rise.
The 50-day and 200-day EMA is reversing upward and the price sustaining above it is showcasing an uptrend.
Recently, RVN crypto witnessed a sharp spike in the buying volume, and the price attempted to break out of the $0.02000 hurdle. But the attempt failed and the session closed by forming a bearish hammer candle.
However, the buyers are still active and trying their best to hold the price above EMA. Ravencoin price has become active after three months of long consolidation. It grabbed the attention of long-term investors and succeeded in reversing the trend in the upward direction.
Meanwhile, the buying volume also increased and the price followed the same direction. It shows that some big investors have injected the money and expected an outperformance.
Currently, Ravencoin price is trading at $0.01886 with an intraday decline of -1.67%. The 24-hour volume to market cap is 9.29%.
Will Ravencoin Price Perform Well in December?

Ravencoin price prediction favors the bulls and suggests that it might perform well in December. The chart pattern of RVN looks bullish so buyers may continue its dominance in the coming months.
Till the price sustains above the $0.01598 level, the buyers will remain active and any minor correction might show a bounce. However, if the situation reverses and the price drops below $0.01598 then the bear might pull it down to the yearly low.
The analysis suggests that the RVN crypto price is inside the bulls’ grip and may show a surprising upmove in December.
RVN Price is in the Recovery Phase
RVN price is in the recovery phase and forming a bullish pattern on the weekly chart. However, the next phase of recovery will begin when buyers are able to break out of the $0.02413 hurdle.
The MACD curve sustains above the zero line and displays a positive crossover. The histogram bar is also green which shows that the price may continue to trade with bullish bias. The RSI at 57 denotes the strength of the bulls and more room for upside is open.
Conclusion
Ravencoin price prediction is bullish for December and suggests a new swing high is possible. The chart pattern of RVN looks bullish and seems that the price is preparing for a big move.
The analysis suggests till RVN crypto price sustains above the 200-day EMA, the possibility of the $0.02413 breakout is high.
Technical Levels
- Resistance levels: $0.02413 and $0.02800
- Support levels: $0.01598 and $0.01345
Disclaimer
The views and opinions stated by the author, or any people named in this article, are for informational purposes only. They do not establish financial, investment, or other advice. Investing in or trading crypto assets comes with a risk of financial loss.
Andrew is a blockchain developer who developed his interest in cryptocurrencies while pursuing his post-graduation major in blockchain development. He is a keen observer of details and shares his passion for writing, along with coding. His backend knowledge about blockchain helps him give a unique perspective to his writing skills, and a reliable craft at explaining the concepts such as blockchain programming, languages and token minting. He also frequently shares technical details and performance indicators of ICOs and IDOs.
 thecoinrepublic.com
