The Bitcoin (BTC) price and the Crypto Market Cap (TOTALCAP) reached new yearly highs on November 27 but have fallen since. FTX Token (FTT) has fallen since creating a lower high on November 23.
In the news today:
- The son of European Central Bank (ECB) president Christine Lagarde lost nearly 60% of his cryptocurrency investments.
- Since he allegedly now resides in Finland, the Securities and Exchange Commission (SEC) faces challenges serving a lawsuit against HEX founder Richard Heart.
Crypto Market Cap Falls After Yearly High
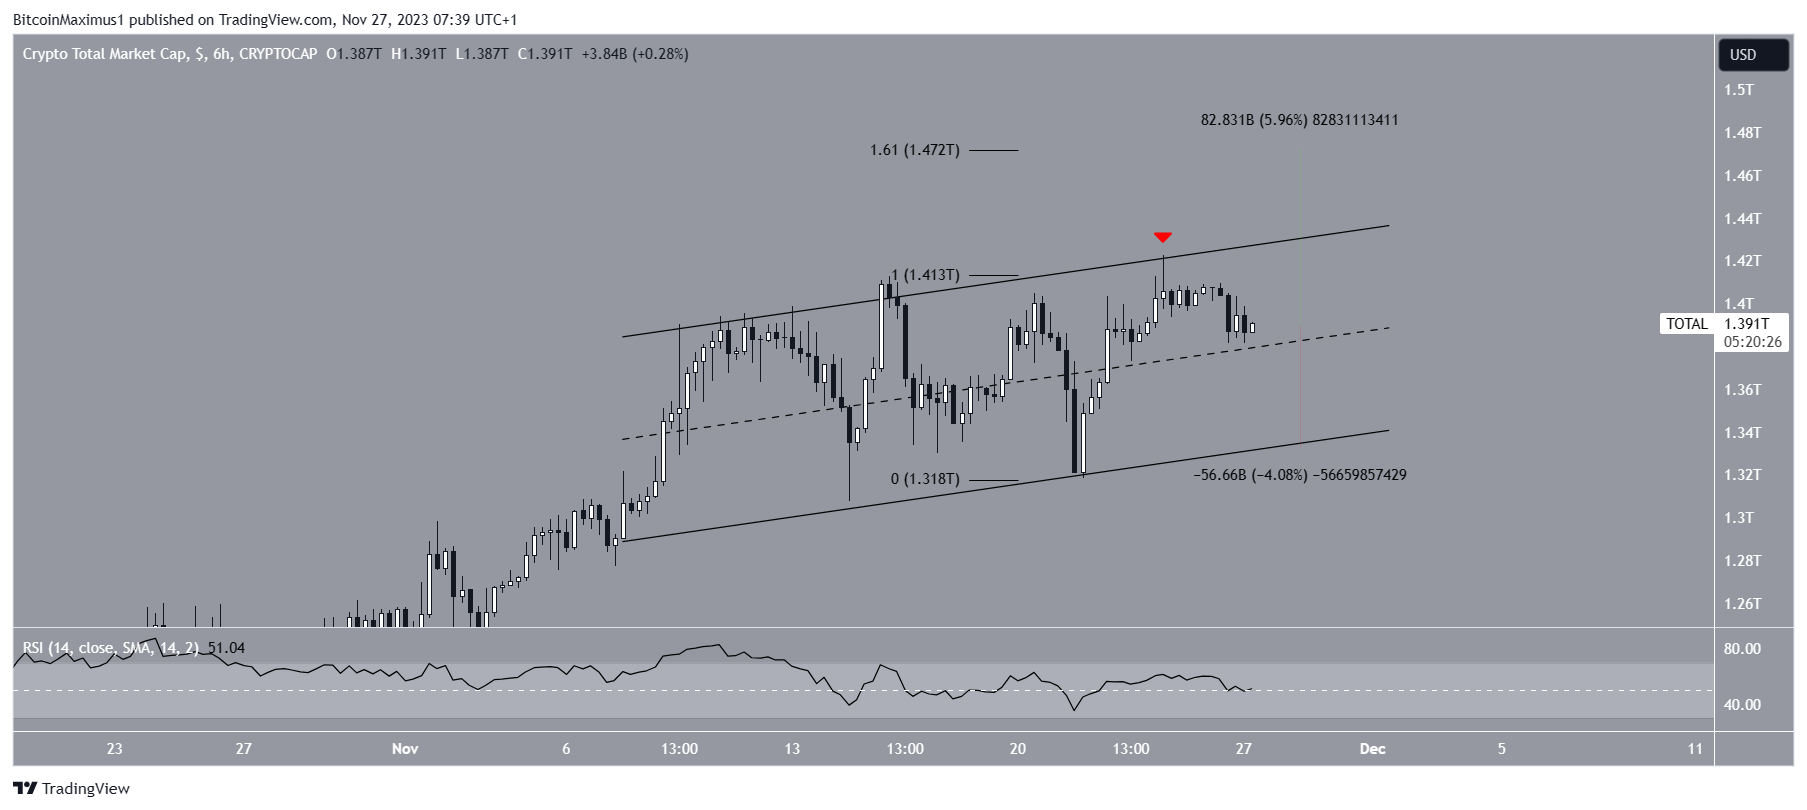
TOTALCAP has increased inside an ascending parallel channel since November 7. The increase led to a new yearly high of $1.42 trillion on November 24. Despite the high, TOTALCAP was rejected by the channel’s resistance trend line (red icon) and has fallen since.
TOTALCAP is now approaching the channel’s midline at $1.38 trillion. The six-hour Relative Strength Index (RSI) is undetermined.
With the RSI as a momentum indicator, traders can determine whether a market is overbought or oversold and decide whether to accumulate or sell an asset.
Bulls have an advantage if the RSI reading is above 50 and the trend is upward, but if the reading is below 50, the opposite is true. The RSI is currently at 50.

Whether TOTALCAP breaks down below the channel’s midline or breaks out from the channel instead will determine the future trend.
A successful breakout can lead to a 6% increase to the next resistance at $1.47 trillion, while a breakdown can lead to a 4% drop in the channel’s support.
Bitcoin Price Deviates Above Resistance
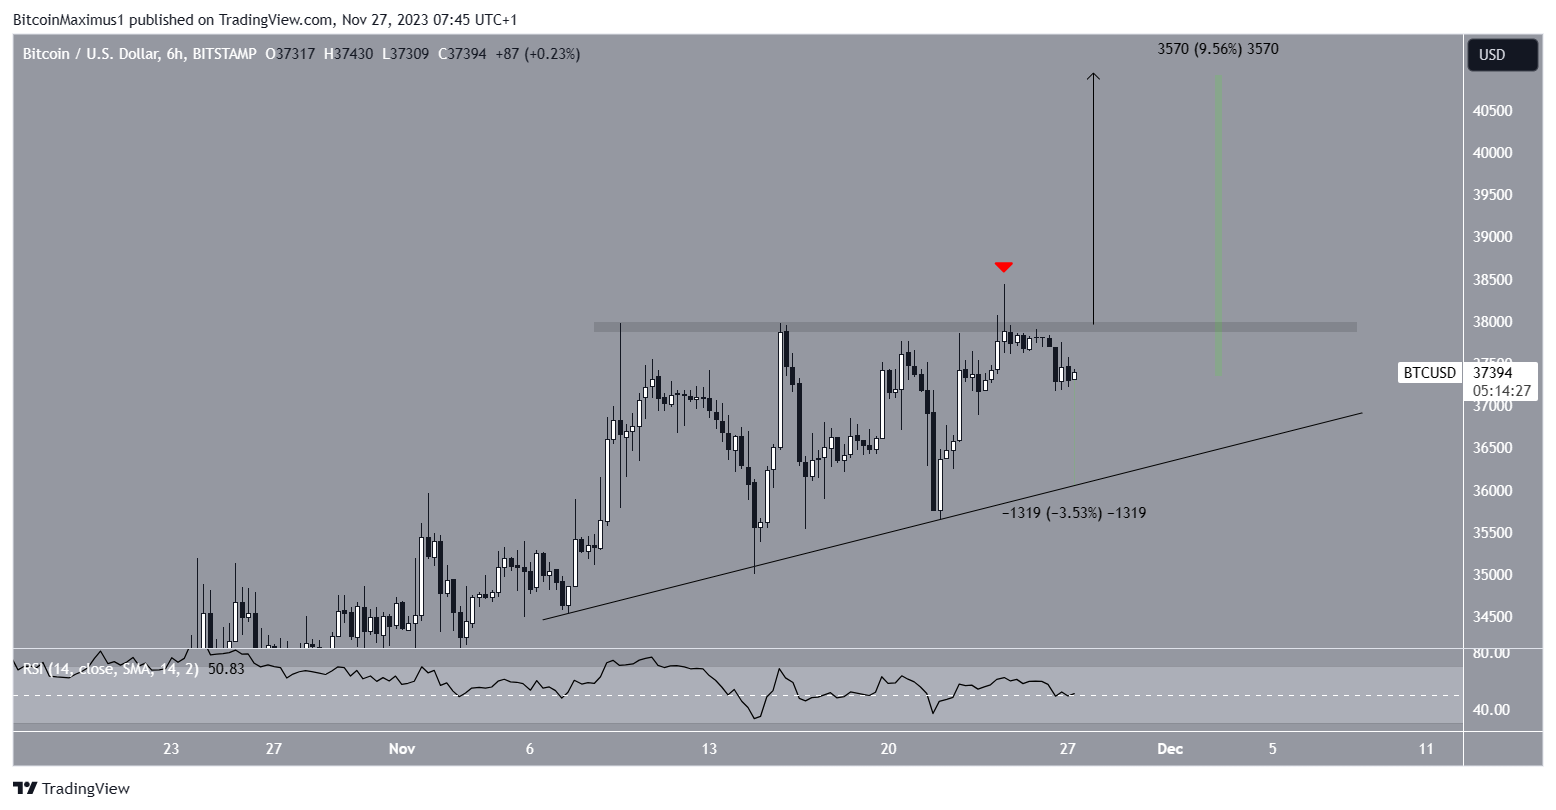
The BTC price has followed an ascending support trend line since November 6. During this time, it also faced resistance at $38,000. Combined, these create an ascending triangle.
After two unsuccessful attempts, BTC finally moved above the area on November 24, reaching a new yearly high of $38,437.
However, it failed to sustain the increase, falling below the area shortly afterward.
Similarly to TOTALCAP, the six-hour RSI is at 50, indicating an undetermined trend.
If BTC breaks out from the triangle, it can increase by 10% to the next resistance at $41,000. The resistance is created by projecting the triangle’s height to the breakout level.

Despite this bullish BTC price prediction, failure to break out from the $38,000 area can lead to a 3.50% drop to the ascending support trend line at $36,000.
FTX Token (FTT) Gets Rejected and Falls
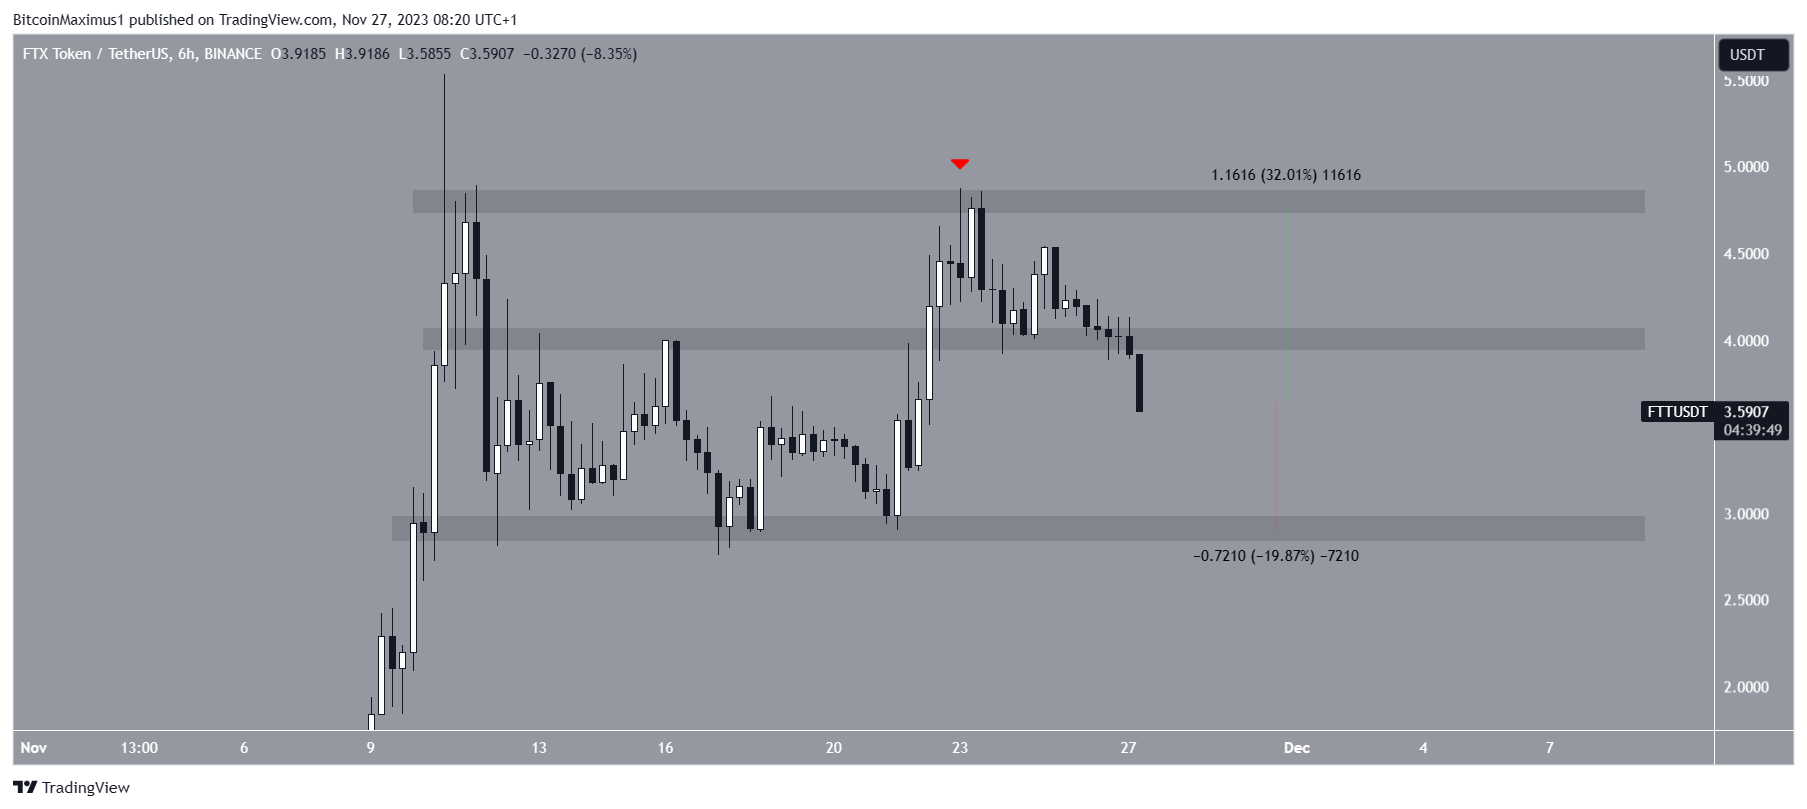
The FTT price has fallen since reaching a high of $5.53 on November 10. On November 23, it made an unsuccessful attempt at initiating an upward movement but was rejected from the $4.80 resistance area (red icon). The price has fallen since.
During the descent, FTT fell below the minor support level at $4.
If the downward movement continues, FTT can decrease by 20% to the closest support at $2.90.

Despite this bearish FTT price prediction, reclaiming the $4 level can cause a 30% price increase to the next resistance at $4.80.
For BeInCrypto‘s latest crypto market analysis, click here.
 beincrypto.com
