- 1 Maker price prediction showcases that MKR is losing the bullish momentum.
- 2 The 50-day EMA in MKR crypto is acting as immediate support.
- 3 MKR price is in an uptrend and buyers are trying to hit a new YTD high.
Maker price prediction suggests bulls are losing momentum and the price may spend some time in consolidation.
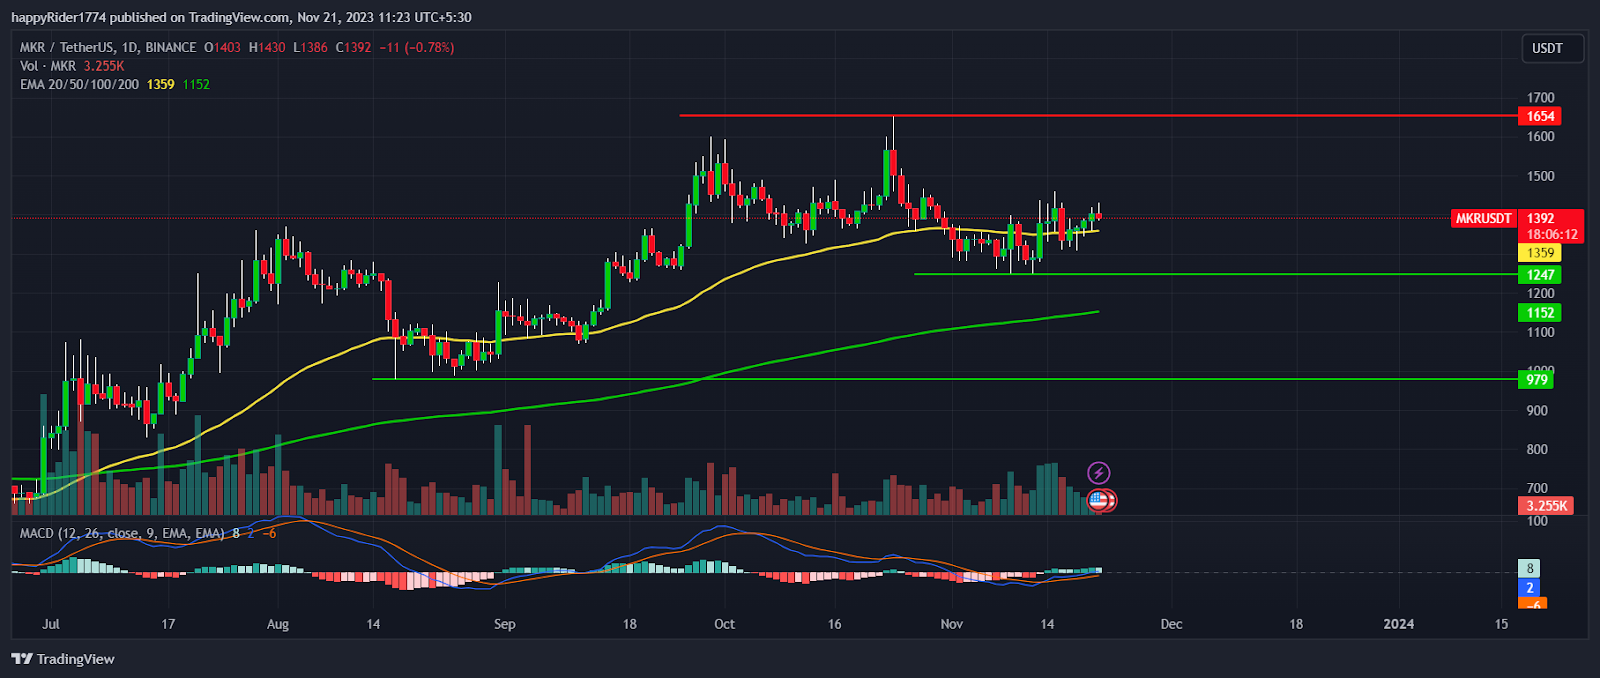
Recently, MKR price faced rejection from the $1600 level and showed minor profit booking from the higher levels. It retraced back to the 50-day EMA and entered a narrow-range consolidation.
In the last 6 months, the Maker crypto price has performed well and generated excellent returns for its investors. Moreover, the overall crypto market sentiment also stayed positive which indirectly supported the MKR bulls.
In October, Maker coin tried twice to break the $1600 barrier. However, sellers came forward and succeeded in defending the $1600 level. Later, bulls lost the battle and slowly the price reverted down.
The short-term correction in the MKR coin has taken a halt near $1250.00 and buyers have shown their presence. The 200-day EMA slopes upward and the price sustaining above it showcases the positional trend is still up.
Furthermore, if the sell-off continues, then the 200-day EMA will act as a strong support for the bulls.
Currently, Maker price is trading at $1392 with an intraday decline of -0.78%. The 24-hour trading volume is up by 36% and the volume to market cap is at 5.94%.
Maker Price Analysis: Will the Bulls Return Back on Track?

Maker price prediction is favoring the bears for the short term period and suggests that the $1300 support is at risk.
The sellers are getting active and trying to drag the price below the 50-day EMA. If they succeed, then 10% to 15% more downside will open. On the lower side, $1250 is a short-term demand zone.
Till the MKR price sustains above it, the probability of bounce back remains high. If the price slips below $1250, then it will be an indication of the bearish trend reversal.
The analysis suggests that MKR crypto is in a short-term correction phase. But after consolidation of a few more weeks, bulls will return to track and push the price above $1500.
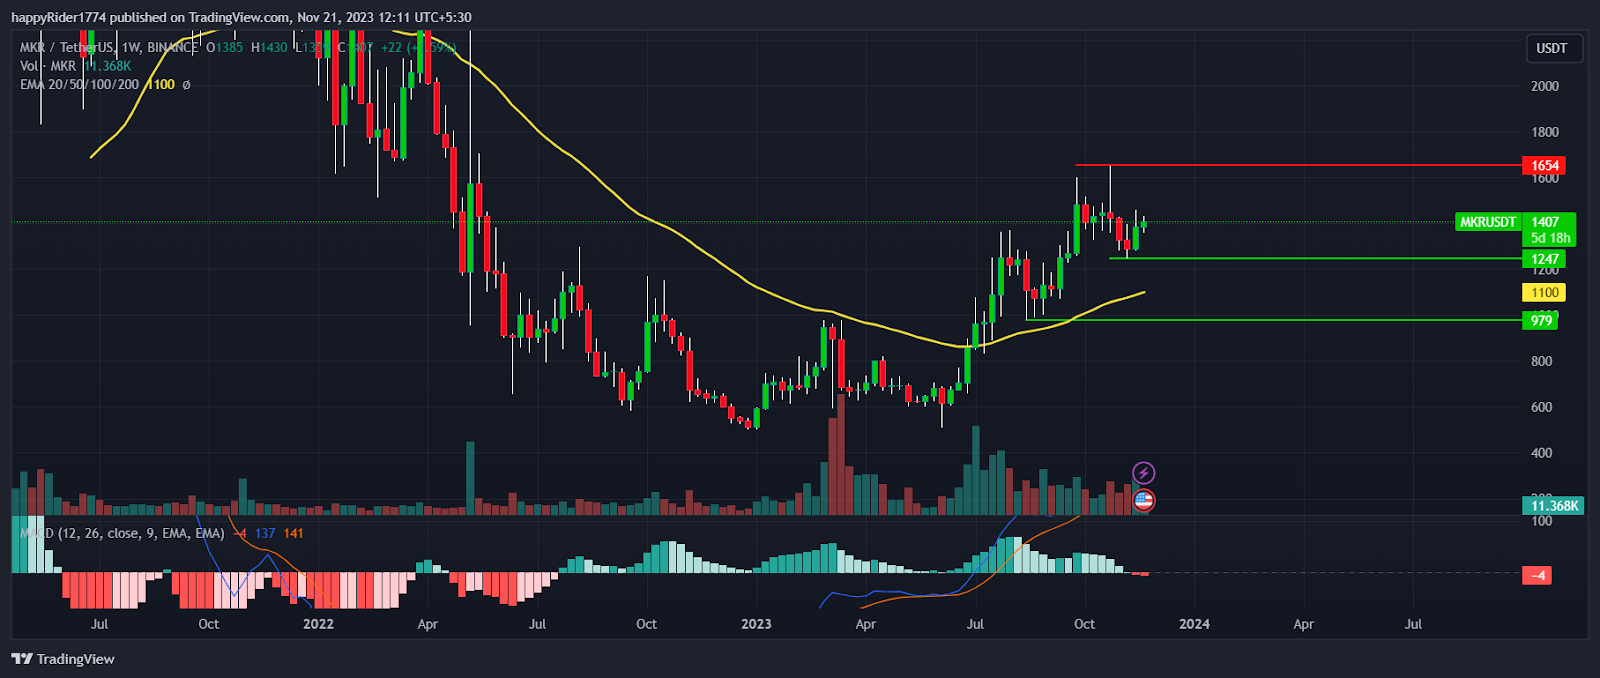
MKR Price Still Bullish on a Weekly Time Frame Chart

MKR price is still bullish on a weekly time frame chart and is forming a bullish pattern. The recovery from the YTD low is powerful and supported by high buying volume. So, if the price retraced down toward $1000, then it will be a good buying opportunity for long-term investors.
On a daily chart, the MACD curve is near the zero line and displays a positive crossover. The histogram bar is green and forms a rising bar. It indicates mild bullishness but the price will gain momentum only after the $1500 breakout.
The RSI at 55 above the neutral territory indicates that the bulls are active. However, the supertrend says, that till the price is below $1500, the short-term trend will remain down.
Conclusion
Maker price prediction suggests that bulls have lost the positive momentum. So, it will be difficult to retest the YTD high by December end.
MKR price is consolidating and buyers are trying their best to rebound. But analysis suggests that until the price breaks the $1500 hurdle, the short-term trend will remain down.
Technical Levels
- Resistance levels: $1500.00 and $1654.00
- Support levels: $1247.00 and $1152.00
Disclaimer
The views and opinions stated by the author, or any people named in this article, are for informational purposes only. They do not establish financial, investment, or other advice. Investing in or trading crypto assets comes with a risk of financial loss.
 thecoinrepublic.com