The Bitcoin (BTC) price and the Crypto Market Cap (TOTALCAP) created bullish engulfing candlesticks yesterday. Render (RNDR) broke out from a critical resistance area.
In crypto news today:
- Binance received approval from Thailand’s SEC to launch a cryptocurrency exchange.
- The US SEC pushed back Hashdex’s Bitcoin ETF decision until January 1, 2024.
TOTALCAP Reaches Another Yearly High
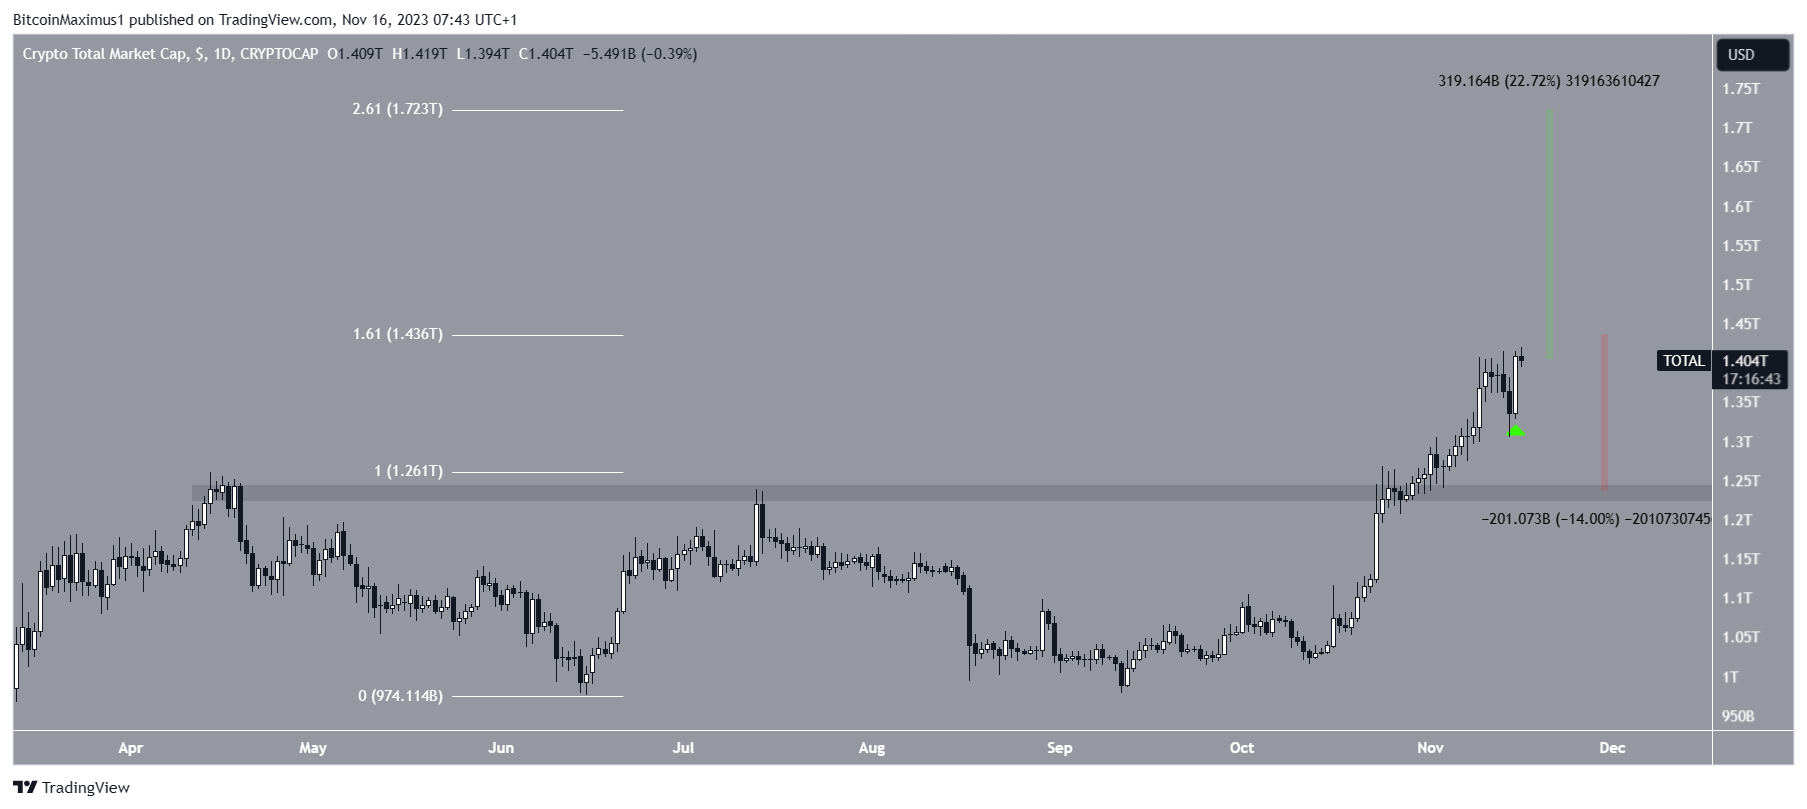
The upwards TOTALCAP move stalled on November 9 after reaching a local high of $1.41 trillion and created several long upper wicks. The decrease that followed culminated with a low of $1.30 trillion on November 14.
Initially, it seemed that TOTALCAP had begun a downward trend after breaking down from a large bullish move.
However, that was not the case since TOTALCAP regained its footing and created a bullish, engulfing candlestick yesterday (green icon). This is a type of bullish candlestick where the entire decrease from the previous period is negated in the next one.
TOTALCAP reached a new yearly high of $1.42 trillion today.
The main resistance area lies at $1.44 trillion, created by the 1.61 external Fib retracement of the previous decrease. If TOTALCAP breaks out above it, it can increase by another 23% and reach the next resistance at $1.72 trillion.

Despite this bullish prediction, failure to break out from the $1.44 trillion resistance could lead to a 14% drop to the closest horizontal support area at $1.22 trillion.
Bitcoin Bounces at $36,000
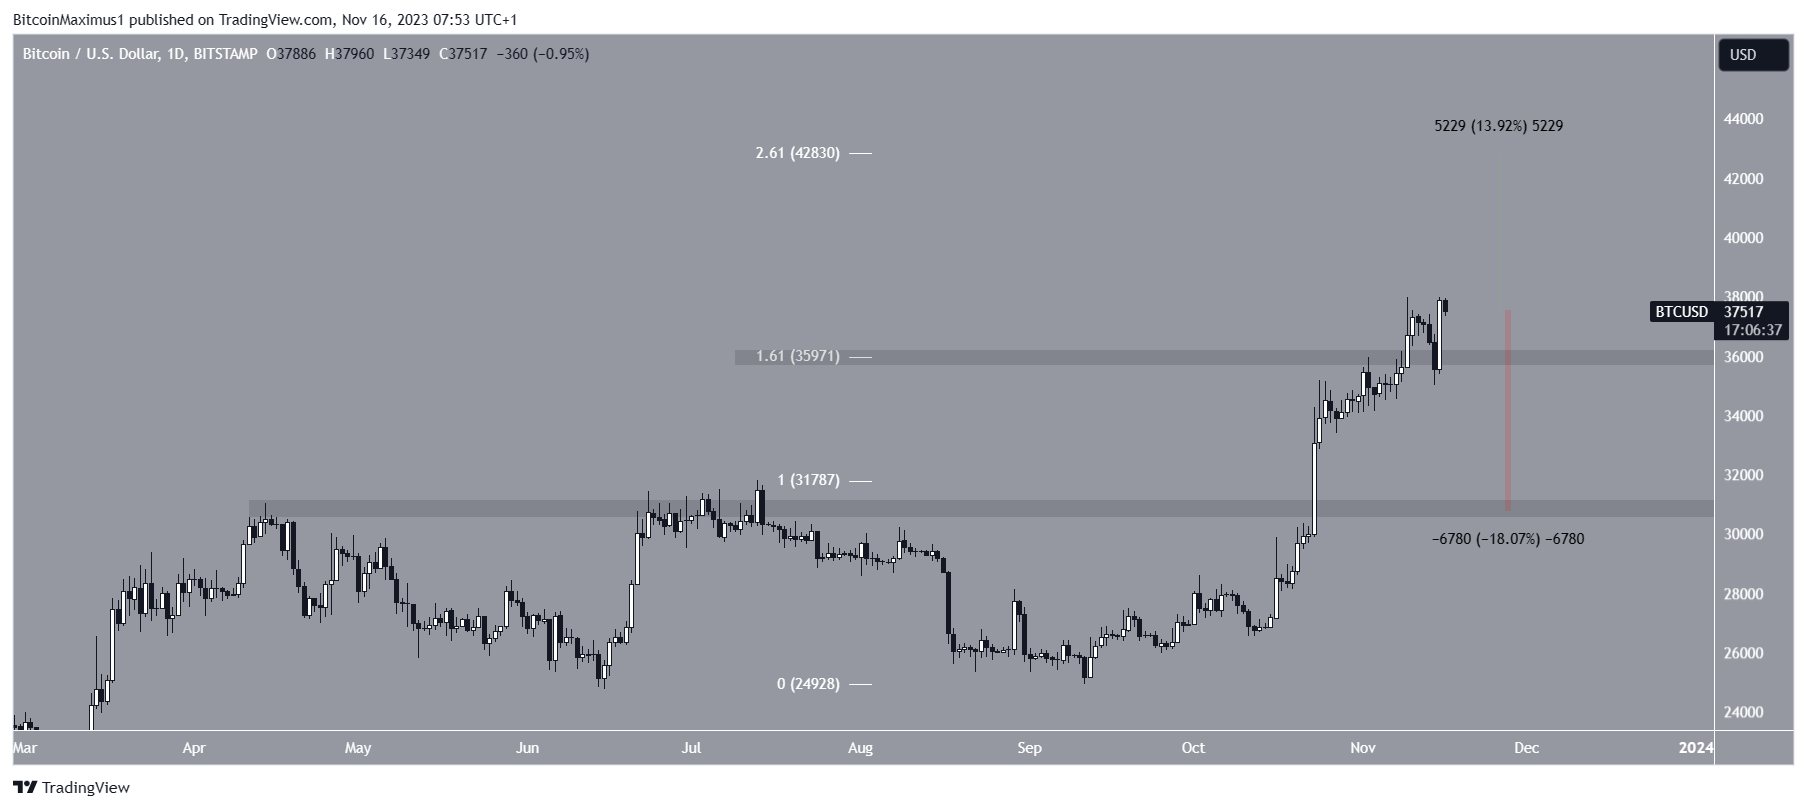
Similar to the TOTALCAP, the Bitcoin price bounced sharply on November 15, saving a breakdown from the $36,000 horizontal area. The $36,000 area is crucial since it is a horizontal support area and the 1.61 external Fib retracement of the previous drop.
BTC created a bullish, engulfing candlestick yesterday and nearly reached a new yearly high. The price culminated at $37,975 before falling slightly.
If the BTC price continues its ascent, it could increase by 14% to reach the next resistance at $42,800. This particular resistance is created by the 2.61 external Fib retracement of the previous drop.

Despite this bullish Bitcoin prediction, a decrease and close below the $36,000 area can lead to an 18% drop to the next closest support at $30,500.
RNDR Also Reaches New Yearly High
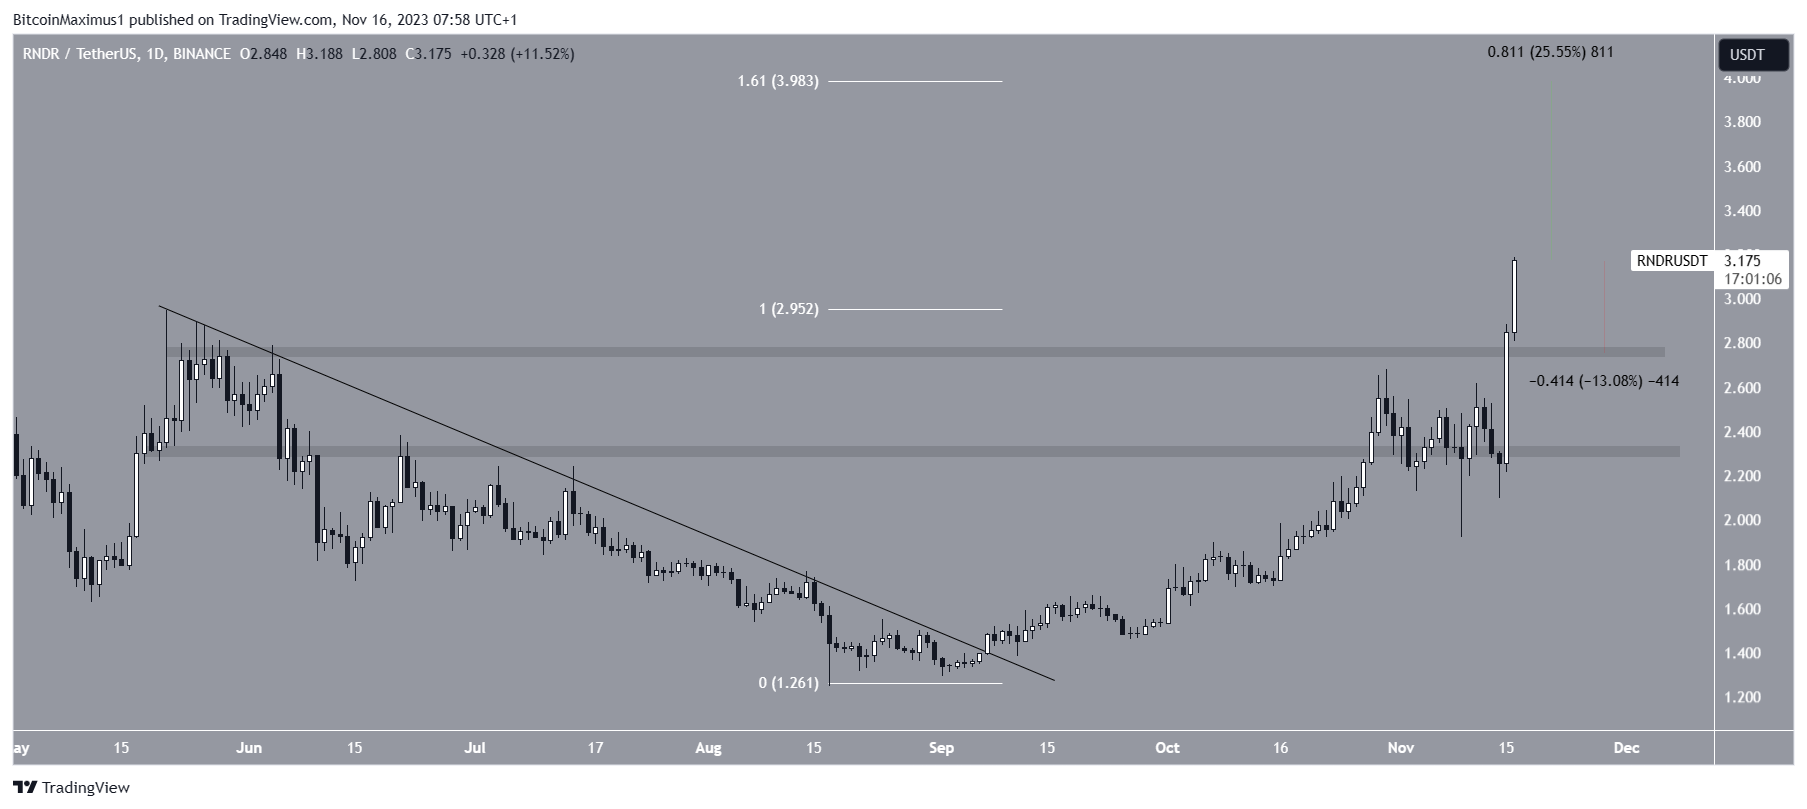
The RNDR price has increased swiftly since breaking out from a descending resistance trend line in September. The increase took the price above the $2.30 resistance area.
While RNDR consolidated above this region for a considerable time, it finally accelerated its rate of increase on November 15.
The price broke out above $2.75 the same day and reached a new yearly high of $3.19 today. If the upward movement continues, RNDR can increase by another 25% and reach the next resistance at $4.

Despite this bullish RNDR price prediction, failure to sustain the increase can lead to a 13% drop to validate the $2.75 horizontal area again.
For BeInCrypto‘s latest crypto market analysis, click here.
 beincrypto.com