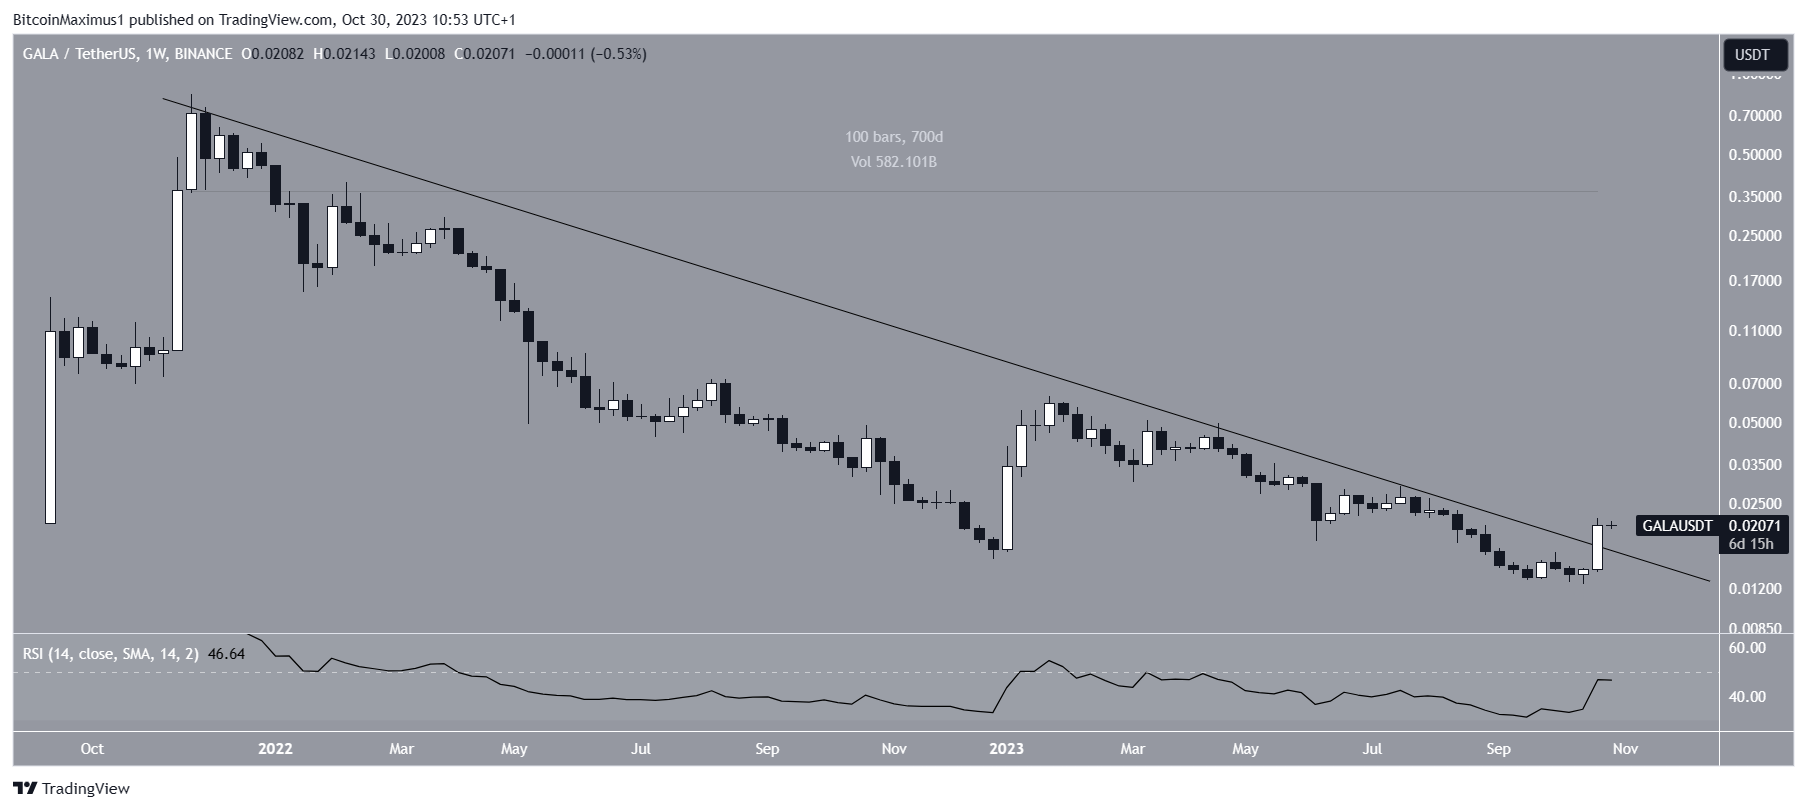
The GALA price broke out from long- and short-term descending resistance trendlines last week.
During the upward movement, GALA also reclaimed two horizontal resistance areas. Is this increase the beginning of a long-term upward trend?
GALA Moves Above Long-Term Resistance
The weekly timeframe technical analysis shows that the GALA price broke out from a 700-day descending resistance trendline last week. The trendline had been in place since the all-time high of $0.840.
Despite the breakout, the weekly Relative Strength Index (RSI) has not turned bullish.
Market traders use the RSI as a momentum indicator to identify overbought or oversold conditions and to decide whether to accumulate or sell an asset.
Read More: 9 Best AI Crypto Trading Bots to Maximize Your Profits
Readings above 50 and an upward trend indicate that bulls still have an advantage, whereas readings below 50 suggest the opposite.
While the indicator is increasing, it has yet to exceed 50, indicating an undetermined trend.

Cryptocurrency traders on X are bullish.
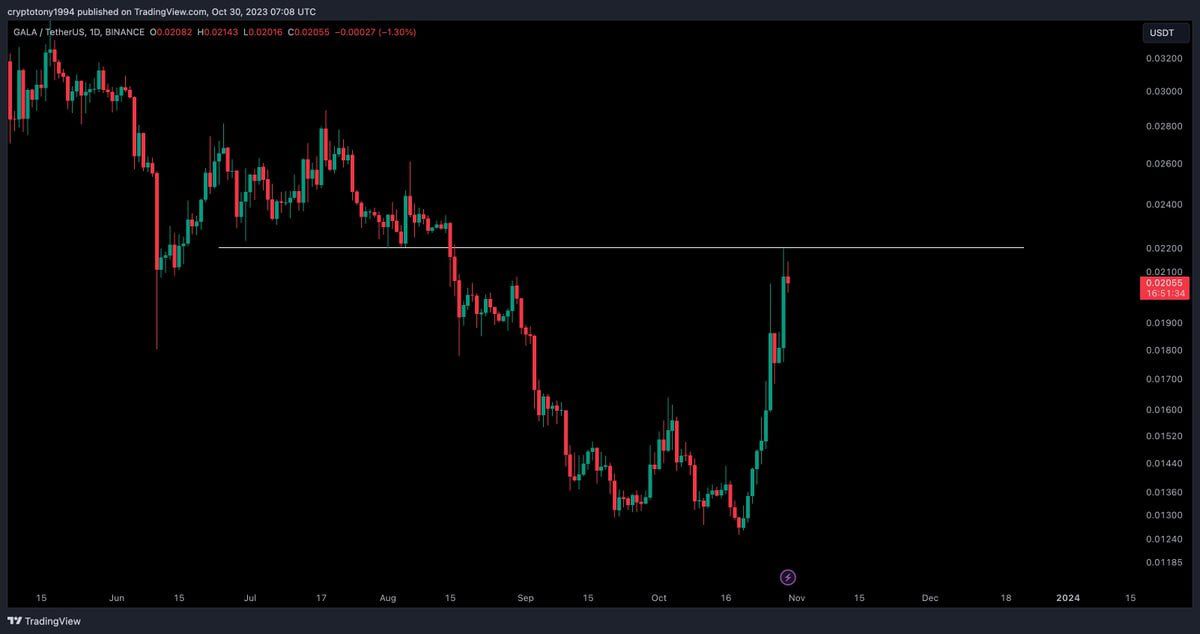
Crypto Tony believes that all gaming coins have now begun their bullish cycle, led by Axie Infinity (AXS) and Apecoin (APE), among others. He further added:
I will be looking for an entry on GALA and will share my chart with you all later on.

Crypto Faibik is even more bullish in the future prospects for the GALA price due to the breakout from the long-term descending resistance trendline outlined.
Read More: 9 Best Crypto Demo Accounts For Trading
GALA Price Prediction: How Long Will Increase Continue?
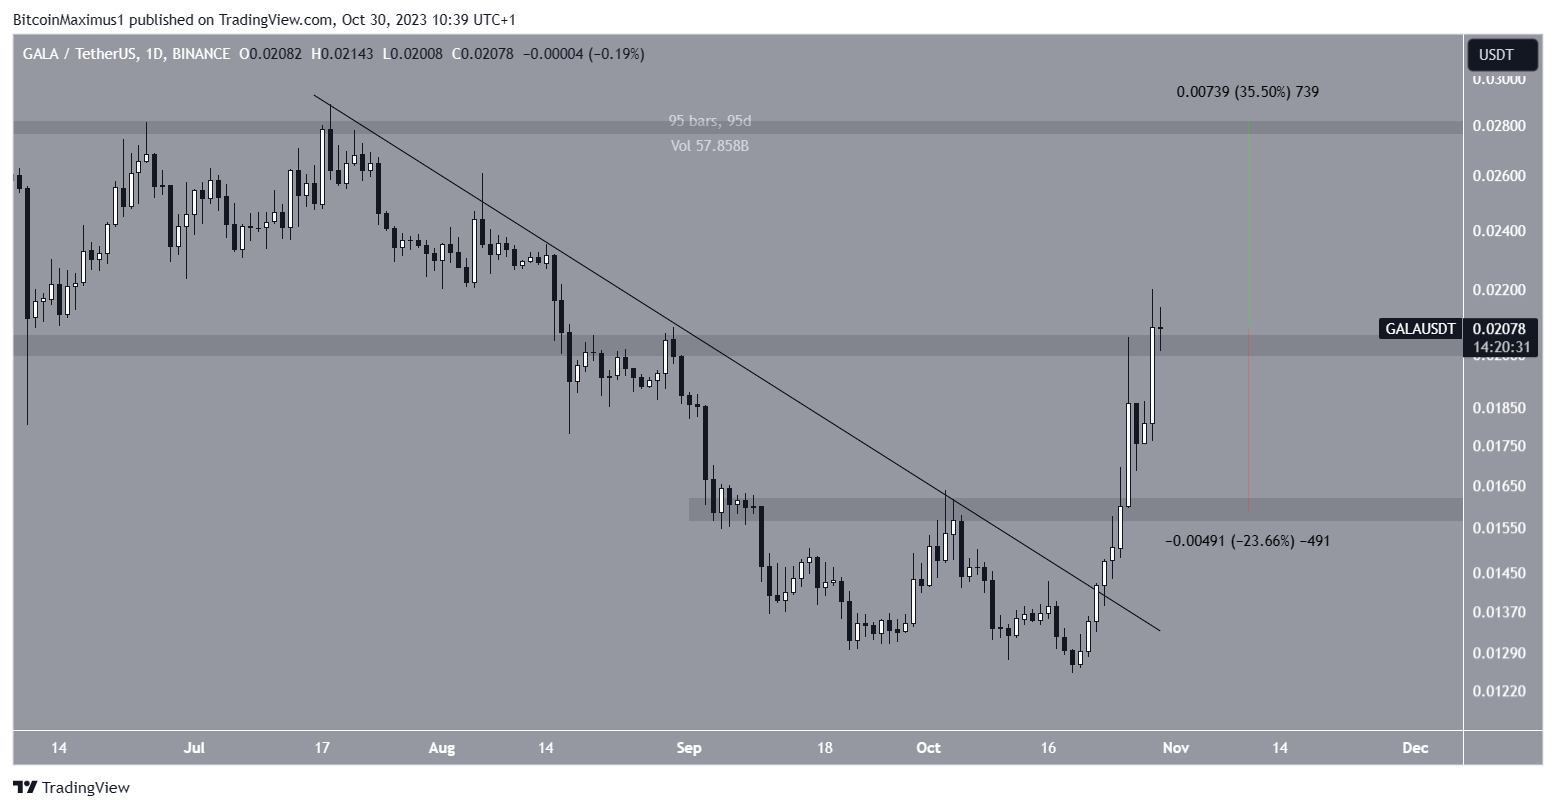
The daily timeframe shows that the GALA price has decreased under a short-term descending resistance trendline since July. The decrease led to a low of $0.012 on October 19.
The altcoin began an upward movement afterward, breaking out from the trendline the next day. At the time, the trendline had been in place for 95 days.
During the breakout, GALA moved above the $0.016 and $0.020 horizontal resistance area. It reached a high of $0.022 on October 29. Combined with the long-term breakout, these are all signs that the trend is bullish.
If the GALA price increase continues, the price can reach the $0.028 resistance area, 35% above the current price.

Despite this bullish GALA price prediction, a close below the $0.020 horizontal area can trigger a 23% drop, validating the $0.016 horizontal support area and the descending resistance trendline.
For BeInCrypto‘s latest crypto market analysis, click here.
 beincrypto.com
