The Apecoin (APE) price has increased by more than 30% since its all-time low price of $0.99 on October 9.
The price broke out from a long-term descending resistance line during the increase. How long will this increase continue?
Apecoin Rallies After All-Time Low
The APE price fell to a new all-time low of $1 on October 9. The decrease culminated in a downward movement ongoing since January, at a high of $6.42. The decrease followed a descending resistance trendline.
Shortly after the low, the APE price reversed its trend and began an upward movement.
Also, it reclaimed the $1.10 horizontal area and reached a high of $1.39 on October 25. At the time of the breakout, the trendline had been in place for 260 days.
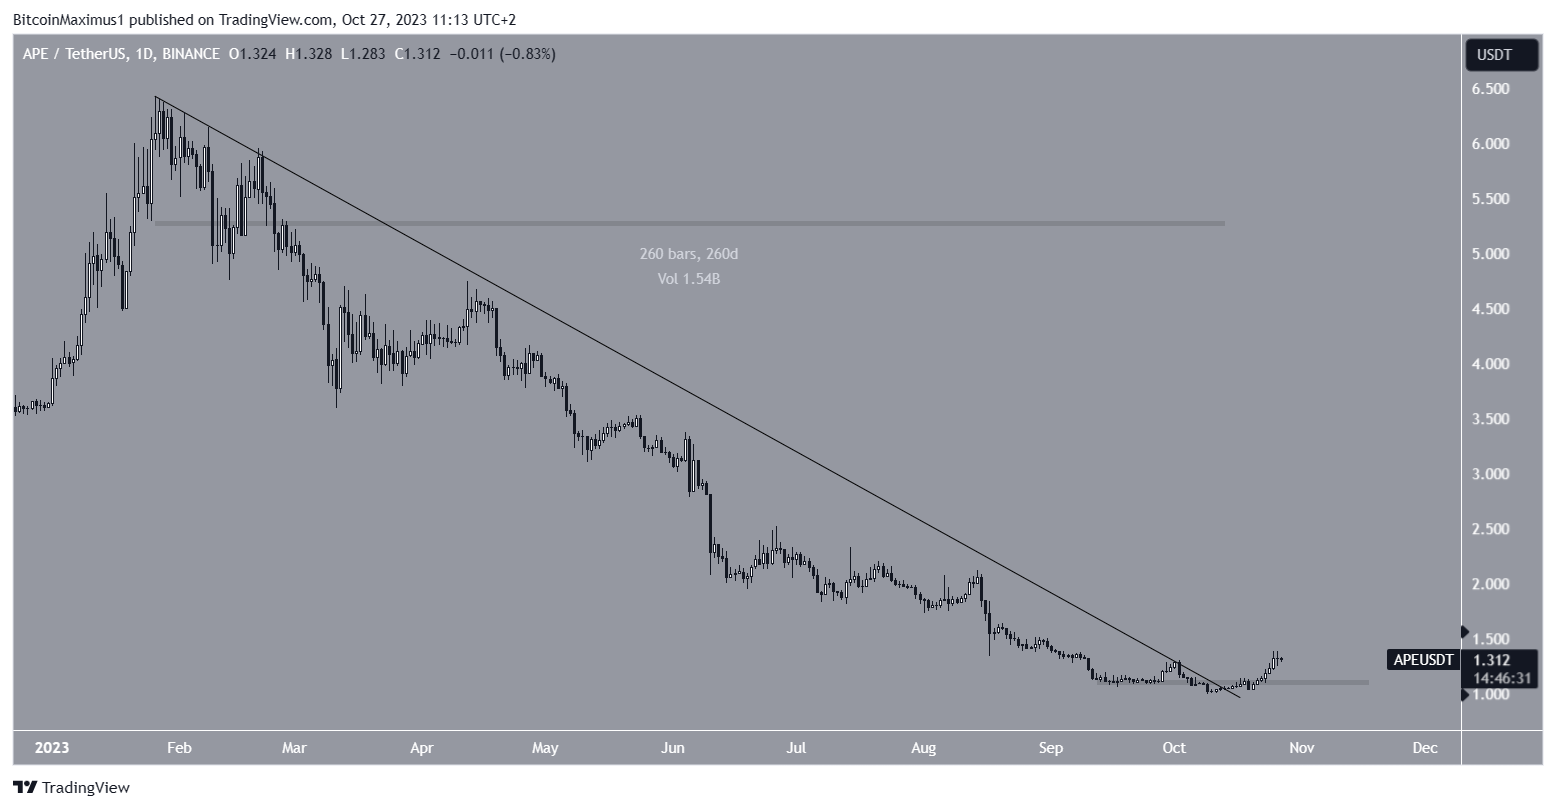
The daily Relative Strength Index (RSI) gives a bullish reading.
The RSI is a momentum indicator traders use to evaluate whether a market is overbought or oversold and whether to accumulate or sell an asset.
Readings above 50 and an upward trend suggest that bulls still have an advantage, while readings below 50 indicate the opposite.
The RSI is increasing and is above 50, both considered signs of a bullish trend.
What Are the Analysts Saying?
Due to the upward movement, cryptocurrency traders and analysts on X are predominantly bullish.
Sheldon_Sniper tweeted the Apecoin price breakout from the descending resistance trendline and believes APE can increase as high as $3.20. He further added:
“10 month down trend now showing a possible strong break out which could end up in big gains”
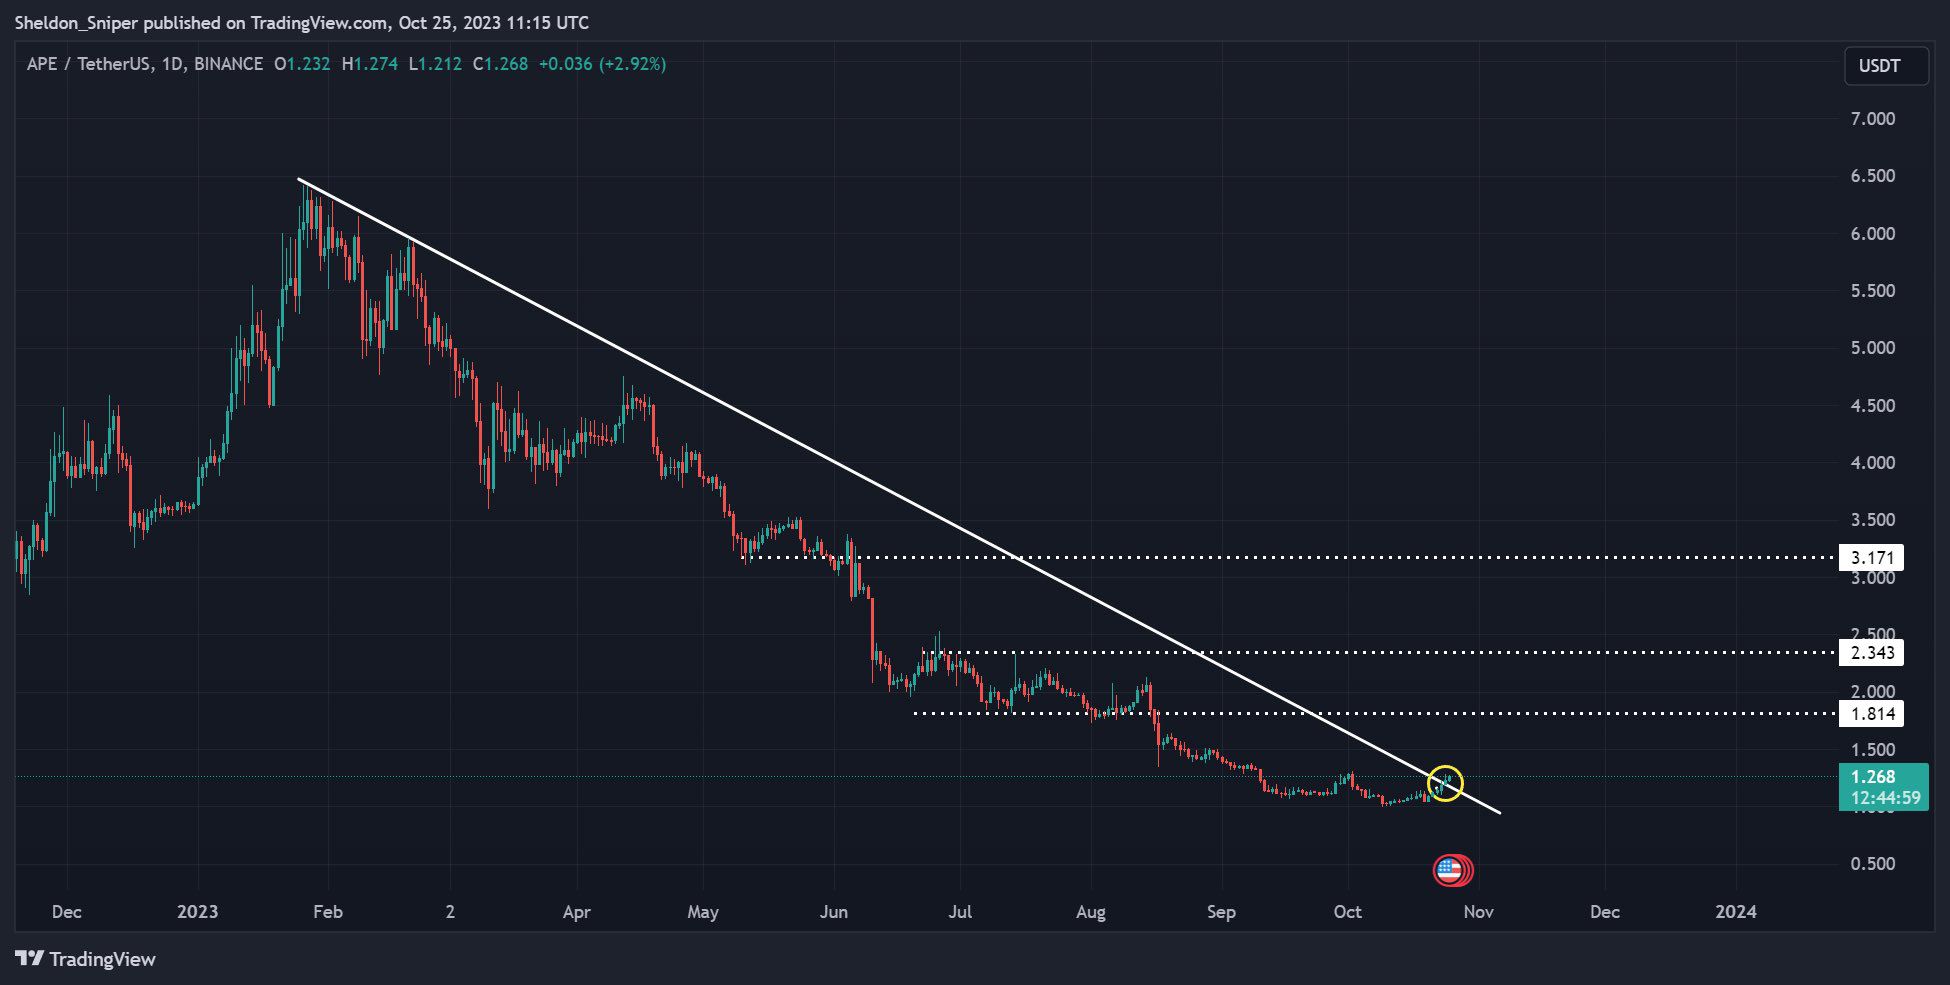
DaanCrypto also shared a very similar chart showing the same breakout.
Traders Cryptowarrior01 and VikingXBT also have a bullish outlook on APE.
However, their predictions are bullish because of a shorter-term breakout from a horizontal resistance.
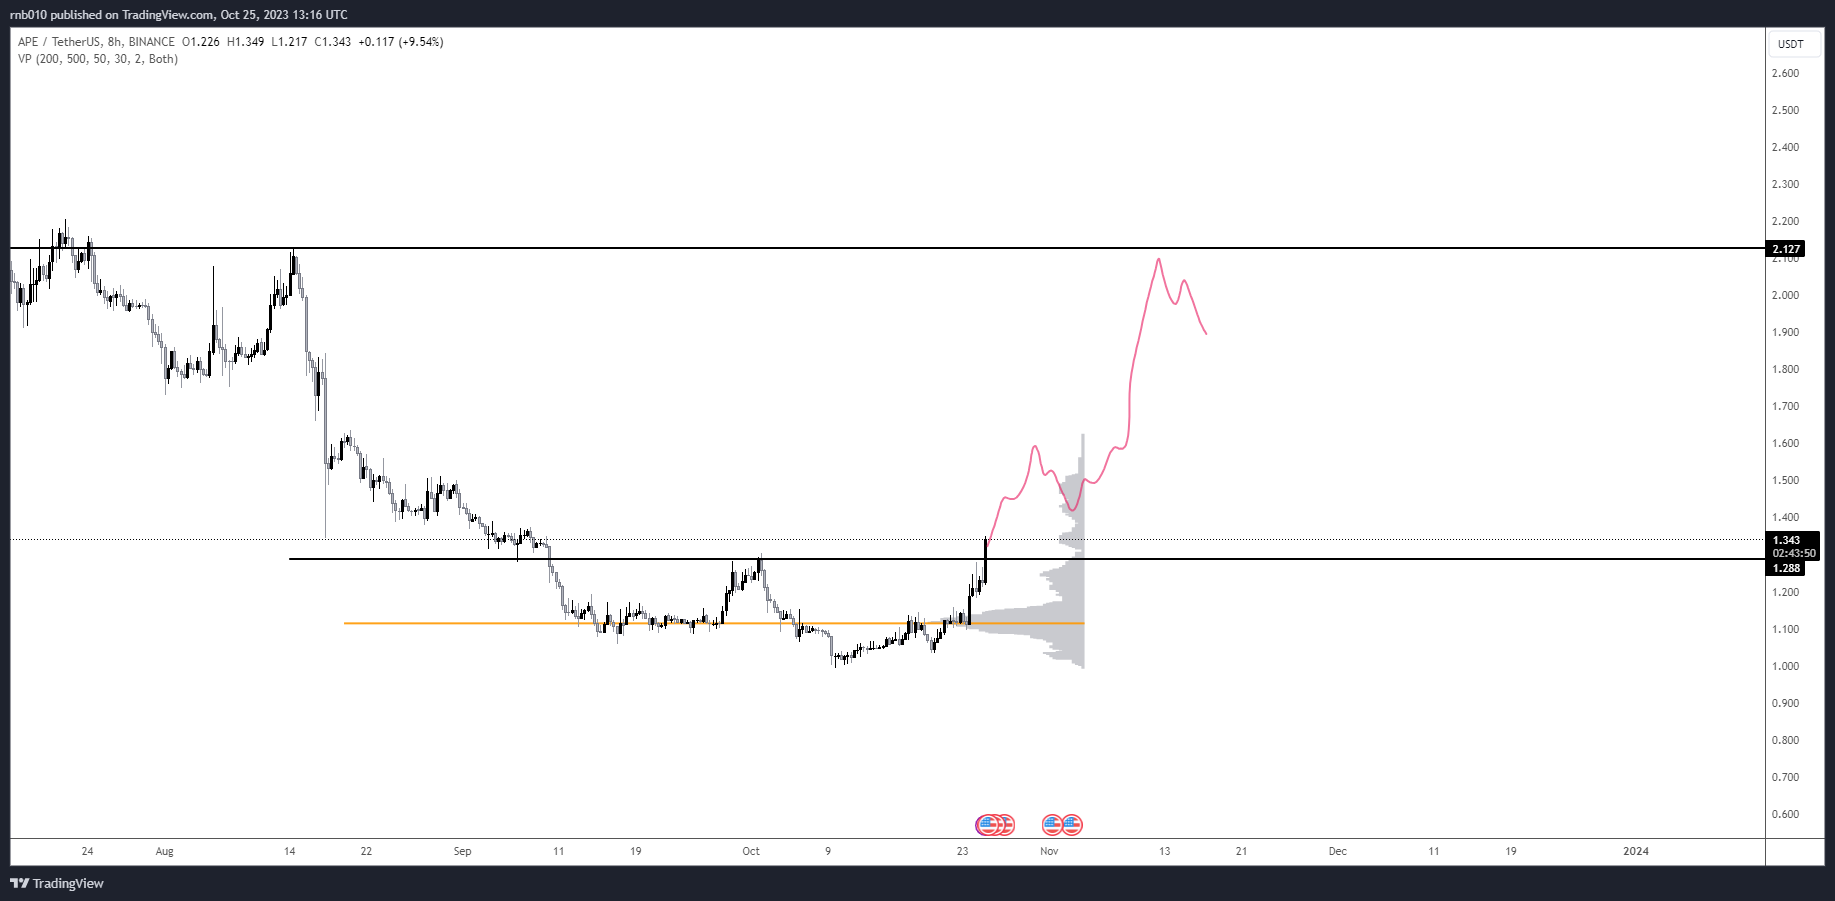
Despite these bullish forecasts, the APE price has fallen slightly since the tweets and is struggling with the $1.30 resistance level.
Read More: 9 Best Crypto Demo Accounts For Trading
APE Price Prediction: Will Price Increase Above $2?
To determine the direction of a trend, technical analysts use the Elliott Wave theory, which involves studying recurring long-term price patterns and investor psychology.
The most likely count suggests that the APE price began a five-wave increase right after its all-time low on October 11. If so, it is currently in wave four of this upward movement.
If the count is correct, APE will complete its correction between the 0.382-0.5 Fib retracement support levels at $1.22-$1.25 before moving to complete the count at the $1.50 resistance area.
This would constitute an increase of 15%, measuring from the current price.
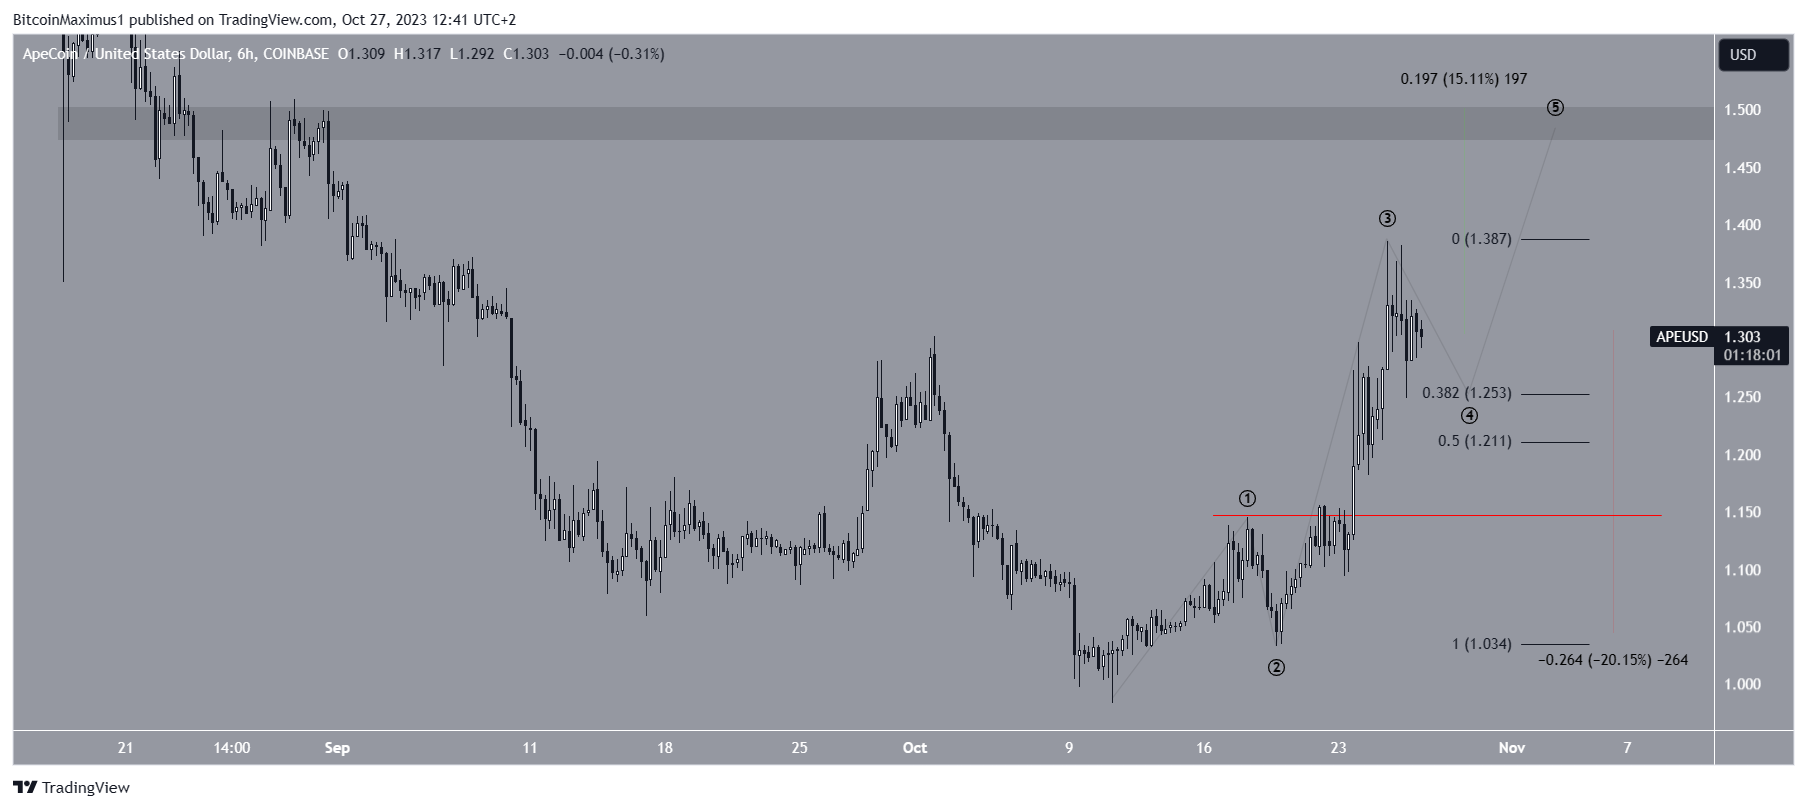
Despite this bullish APE price prediction, a decrease below the wave one high at $1.15 (red line) will invalidate this bullish count.
In that case, APE can decrease by another 20% and reach the closest support at $1.05.
Read More: 9 Best AI Crypto Trading Bots to Maximize Your Profits
For BeInCrypto’s latest crypto market analysis, click here.
 beincrypto.com
