- 1 EOS gained over 2.27% in the past 24 hours and currently trades at $0.6001.
- 2 EOS crypto price has gained over 12% in the past five intraday sessions.
- 3 The EOS crypto price witnessed a consolidation of over two months in a 15% range.
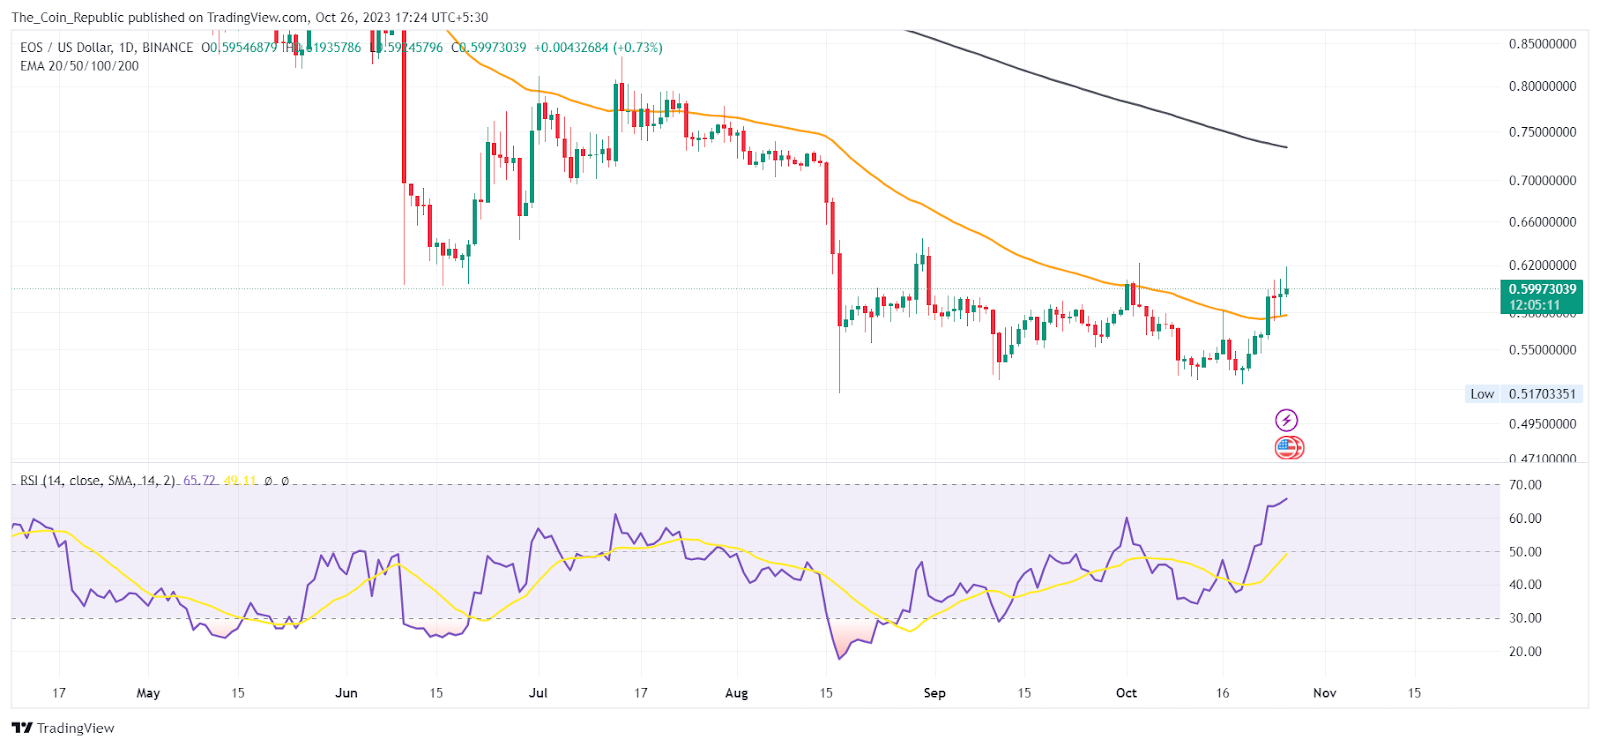
Eos price is up 2.25% today and currently trades at $0.6001. The EOS price hovers in a 15% range and shows accumulation. The accumulation has been over two months and the price has not yet been able to decide a clear trend till now.
The bulls and bears are in a tough fight but none seems to be dominating the price trend. Recently, the EOS crypto price bounced from the lower boundary of the accumulation and is headed to test the sellers’ presence at the upper levels.
The technical indicators imply that the EOS price has surpassed the 50-day EMA but still hovers in the range. The price may gain momentum once it breaks out of the range. Currently, the price hovers in a range with support at $0.51 and resistance at $0.59.
The volume analysis shows that the EOS crypto price has a trading volume of $119.9 Million in the past 24 hours which is 11.80% less than the last day. The EOS crypto has a market cap of $667.95 Million and ranks 60th in the crypto market. The volume-to-market-cap ratio is 16.65% indicating mild volatility in the market.
Eos Price Accumulates In a 15% Range

The EOS price hovers in the 15% range and is accumulating. The price prediction indicates an indecisive trend until it is maintained in the range. The breakout may turn the trend in favor of buyers and the price may show gains in the coming sessions.
Moreover, if the sellers dominate and the EOS price shows a breakdown, then the price may test lower demand zones and erode some more value from its current market cap.
Technical Indicators Shows Neutral to Bullish Outlook

MACD lines are showing an optimistic crossover. The histogram bars are also formed above the mean line of increasing height, indicating the bulls regaining in the short term.
The EMA analysis shows that the EOS price broke above the 50-day EMA indicating the bulls’ dominance in the short term. However, the 200-day EMA is still far above the current price indicating a bearish trend prevailed in the long term.
Conclusion
EOS price hovers in a range between $0.51 and $0.59 for more than two months. The price bounced from the lower boundary and is near the 50-day EMA. The price may break out of the range and gain momentum. The volume is low and the market cap is $667.95 Million.
Moreover, the price needs more volume to break the resistance at $0.59. The price may fall if it breaks the support at $0.51 and tests lower levels. The trend is unclear until the price decides a direction.
Technical Levels
- Support Levels: $0.529 and $0.420
- Resistance Levels: $0.631 and $0.731
Disclaimer
The views and opinions stated by the author, or any people named in this article, are for informational purposes only and do not establish financial, investment, or other advice. Investing in or trading crypto or stock comes with a risk of financial loss.
 thecoinrepublic.com