- 1 The IOTA coin’s price has been on a consistent lower low and high pattern.
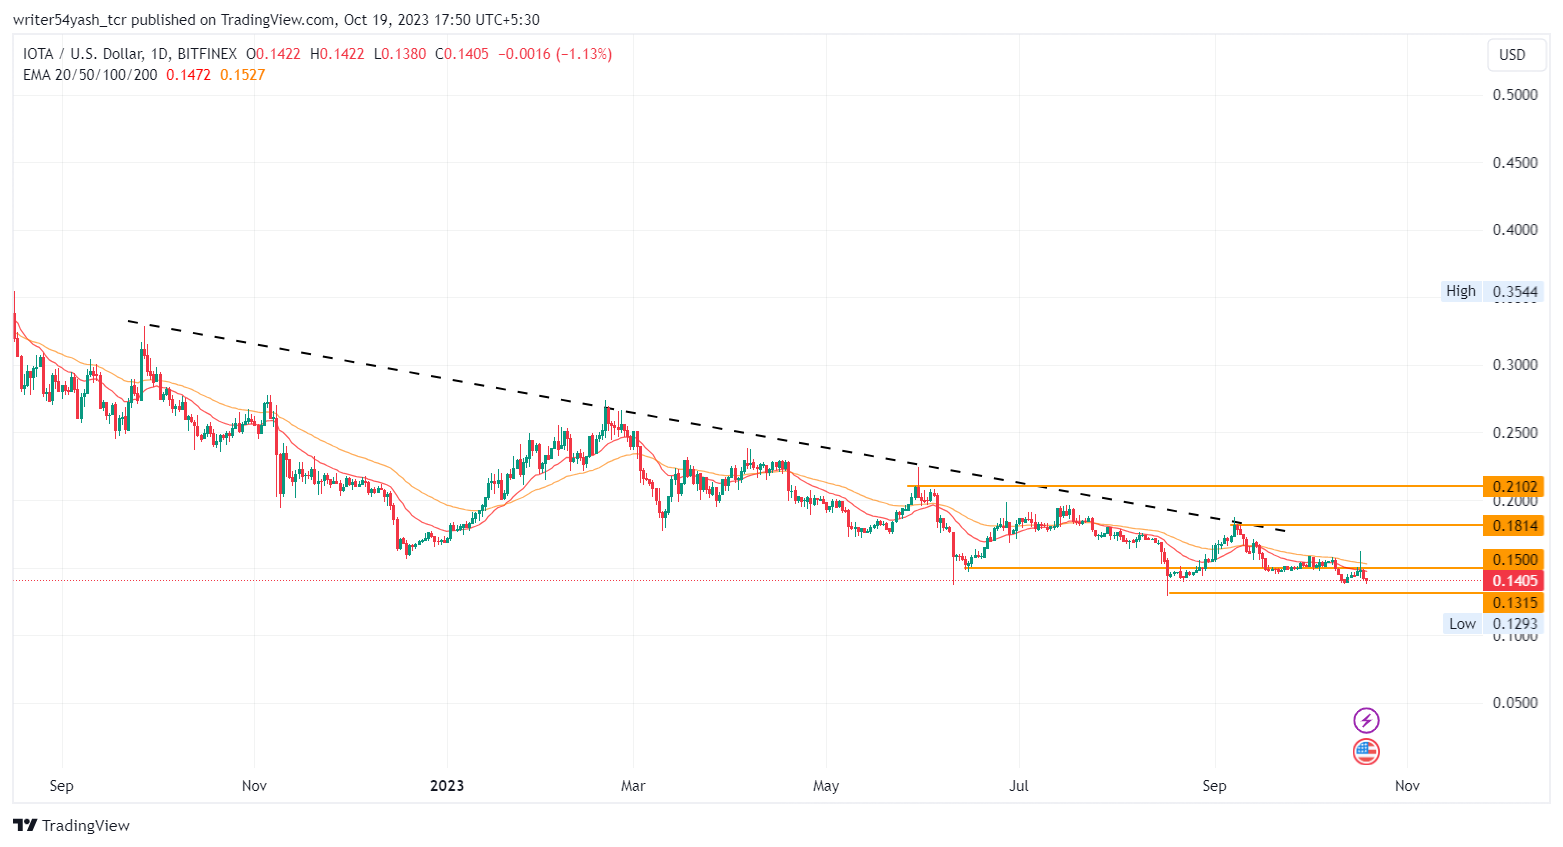
- 2 The price of the IOTA coin is trading at $0.1405 and trading below major EMA’s.
Tangle is the unique technology behind IOTA, a ledger that differs from blockchains. It consists of nodes that verify transactions without blocks or chains. The platform’s creators claim that this makes it faster than traditional blockchains and ideal for the growing Internet-of-Things.
IOTA has been seeing a downtrend from the past 1 year. It has lost 44.19% of its value in the over that period, which is a drastic decline. Also, the asset has not recovered from this bearish trend.
Even in the Year to date period, the IOTA has dropped by 17.61%, showing a lack of investor confidence and demand. Furthermore, IOTA plummeted by 30.19% in the last six months, whch hihlights that the crypto is facing some serious challenges and competition.
Also, in the last three months, IOTA has fallen by 9.84%, which has reflected its inability to attract buyers and reverse its losses. However, the IOTA has shown some signs of stabilization in the last month, as it has only declined by small percentage which is 1.31%, which is a relatively a small change compared to the previous periods.
Collectively, IOTA coin price has been on a downward spiral, breaking multiple support levels along the way. This may indicate that the IOTA is reaching a support level or a bottom, where it may bounce back or consolidate.
The price is currently trading around $0.1401, which is a liquidity zone where sellers are dominant and buyers are scarce.
The price may continue to slide down and reach the next support levels at $0.1315 and $0.1293 if it cannot hold the current level.
On the other hand, if the price manages to stay above the current level and bounce back, it may face the next resistance levels at $0.1500 and $0.1814.


At the time of publishing, IOTA is trading below the 20 and 50-day EMAs (exponential moving averages).
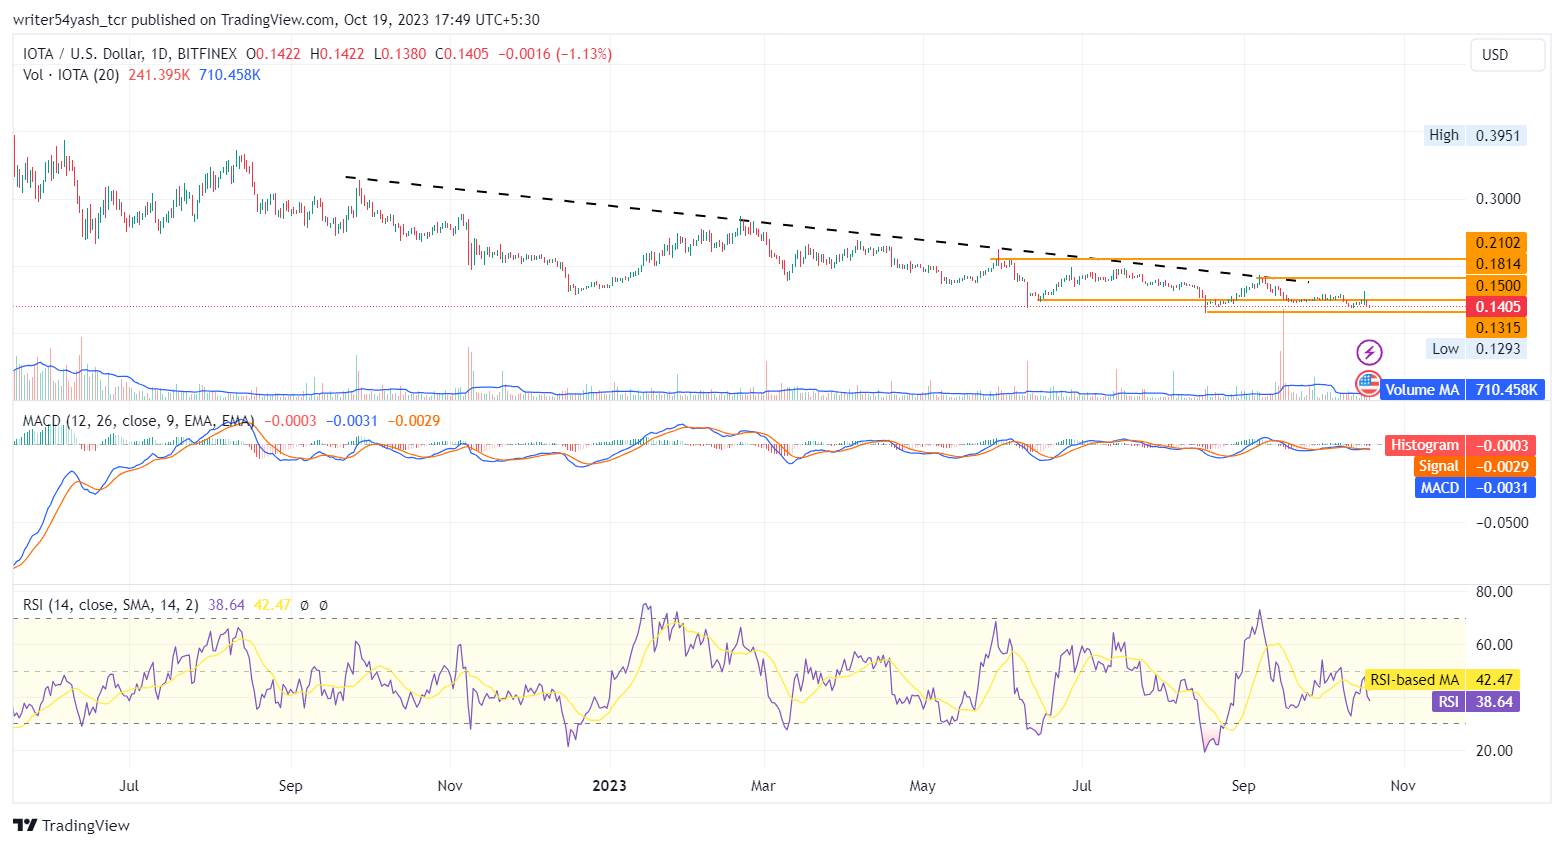
The MACD line at 0.0031 and the signal line at 0.0029 are below the zero line. Both lines cross each other showing a bearish crossover but the histogram is lean showing traits of consolidation.
The current value of the RSI is 38.64 points and the 14-day SMA is below the median line at 42.47 points, and facing rejection from 14 SMA.
Conclusion
IOTA price action highlights a bearish view at the time of publishing. The technical parameters of the IOTA price show bearish traits, suggesting the continuation of the bearishness over the daily time frame chart. Moreover, the IOTA price highlights the bearish sentiments and perspectives of investors and traders regarding the coin in the daily time frame.
Technical Levels:
- Support levels: $22 and $20
- Resistance levels: $26 and $28
Disclaimer
In this article, the views and opinions stated by the author, or any people named are for informational purposes only, and they don’t establish the investment, financial, or any other advice. Trading or investing in cryptocurrency assets comes with a risk of financial loss.
 thecoinrepublic.com
