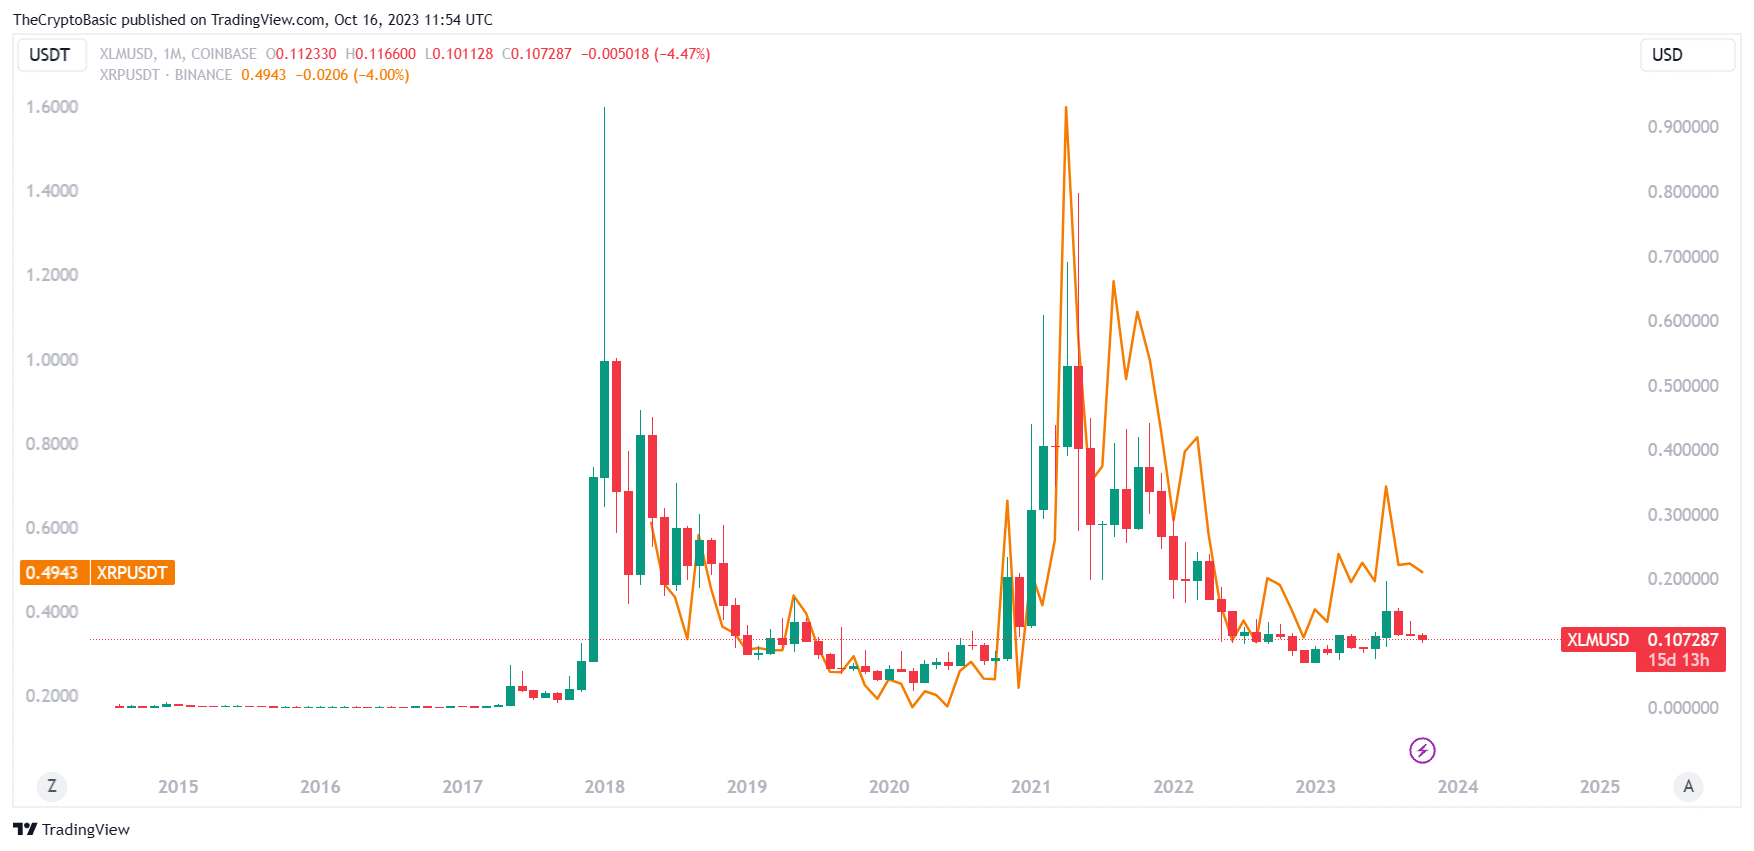
Renowned crypto analyst EGRAG has called attention to Stellar (XLM), a token that has continued to mirror the price movements of XRP since 2018, with a potential for a significant upsurge.
EGRAG addressed investors with a bearish stance on XLM in his latest analysis, delivered this morning. The analyst charged these investors to rethink their sentiment towards Stellar, citing solid potential.
While his chart only provides data on XLM’s price actions, an investigation by The Crypto Basic confirms the theory of a correlation with XRP.
Correlation between XRP and XLM
Notably, XLM surged to its all-time high of $0.9309 in January 2018. This was the same month that XRP rallied to an all-time high of $3.31. Like XRP, XLM also dropped from the all-time high, collapsing to a low of $0.0261 in March 2020. XRP had also plummeted to a low of $0.1013 that month.

When XRP staged a comeback, gaining by 177% in November 2020, XLM also rallied, appreciating by 160%. XRP dropped by 66% in December 2020. In response, XLM also shed 37% of its value.
Recall that XRP recorded one of its biggest rallies in April 2021, skyrocketing to a high of $1.9669 on the back of a 180% upsurge that month. XLM followed suit, rallying to $0.7978 before facing setbacks. XRP has continued to dip since the April 2021 high, with XLM also facing similar drops.
Bullish XLM Perspective
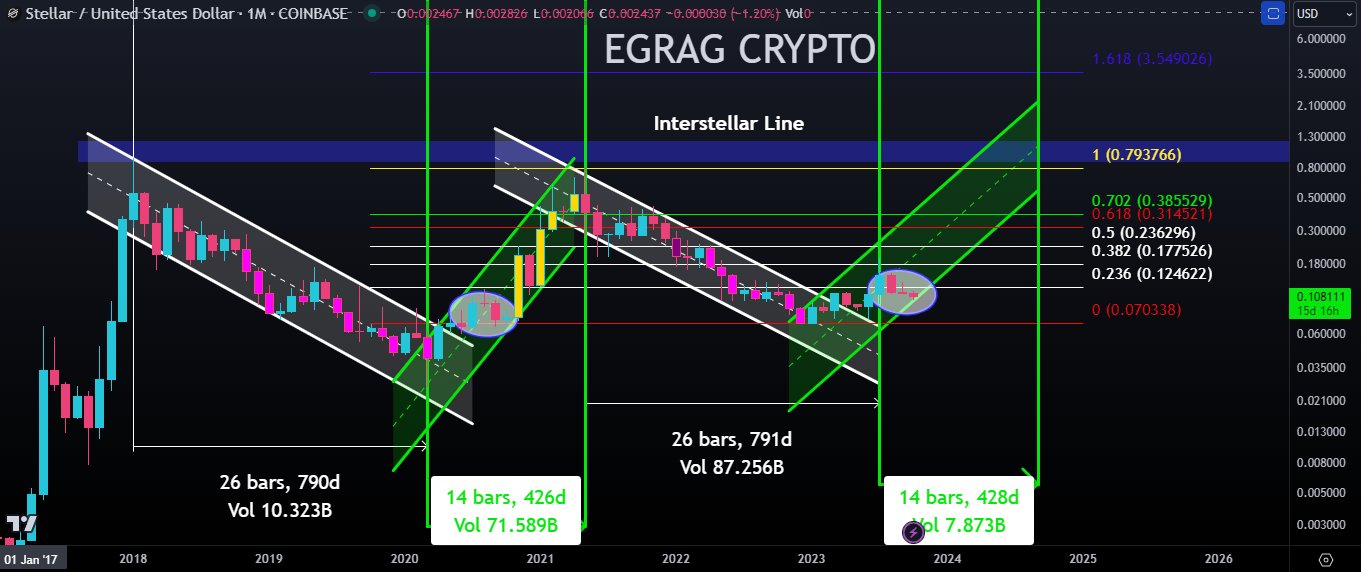
Highlighting this strong correlation, EGRAG stressed that when XRP, the “big brother,” rallies, XLM follows. Data from EGRAG’s chart reveals a series of channels XLM has followed since January 2018 in tandem with XRP. Based on his bullish outlook for XRP, the analyst believes XLM deserves a similarly bullish perspective.

Notably, the first channel spanned January 2018 to May 2020, indicating a downtrend. The second channel ran from April 2020 to May 2021, revealing an uptrend. The fourth channel was another downtrend from June 2021 to December 2022.
EGRAG’s chart suggests that XLM has entered the next channel, which is expected to be another uptrend. Currently trading for $0.1072, XLM is over 82% up from its value in December. Despite this, the chart projects further rallies for the asset, specifically to the $1 price range.
 thecryptobasic.com