The crypto market cap (TOTALCAP) and the Bitcoin (BTC) price began significant bounces on October 16. The Bitcoin SV (BSV) price has nearly reached the $40 resistance area.
The U.S. government has seized roughly 200,000 BTC from cybercriminals. This gives it $5.4 billion in BTC, making it one of the largest Bitcoin holders.
TOTALCAP Can Create Four Consecutive Bullish Candlesticks
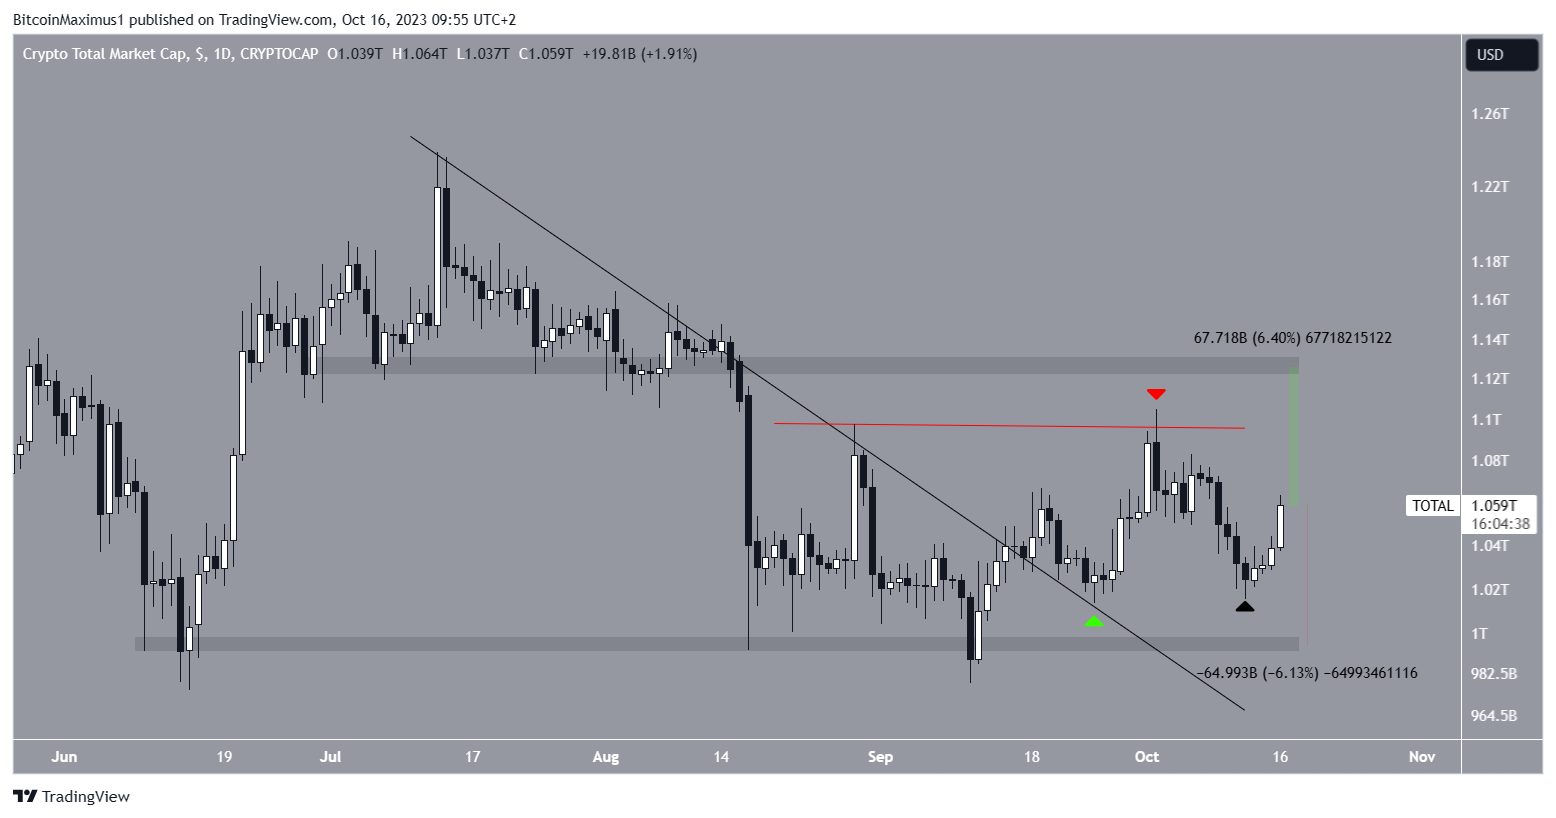
TOTALCAP has moved upwards since September 11, when it validated the $1 trillion horizontal support area as support and bounced. Seven days later, TOTALCAP broke out from a descending resistance trendline.
The price returned and validated the trendline as support on September 25 (green icon). Then, it bounced and reached a high of $1.10 trillion on October 2.
Read More: 9 Best AI Crypto Trading Bots to Maximize Your Profits
While TOTALCAP fell afterward, creating a long upper wick (red icon), it created a higher low on October 12 (black icon). Since then, it has created three consecutive bullish candlesticks and is in the process of creating its fourth.

If the increase continues, TOTALCAP can reach the $1.13 trillion resistance area, 6% above the current price.
However, if the rally loses momentum, a 6% drop to the $1 trillion support area will likely be the future price outlook.
Bitcoin Approaches Critical Resistance
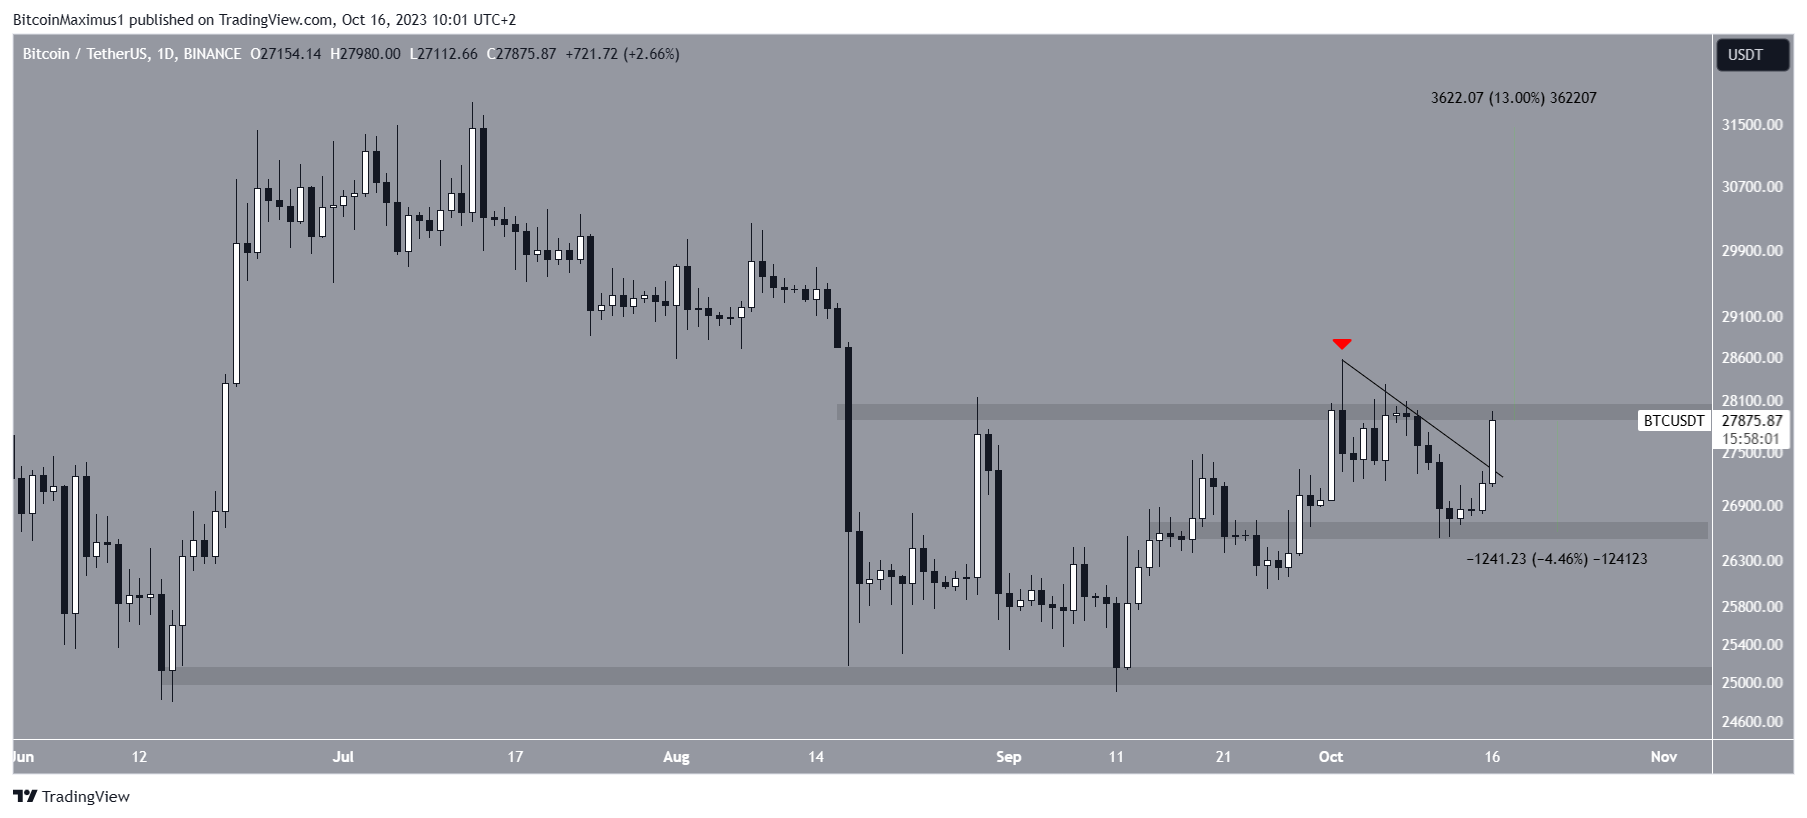
The BTC price has fallen under a descending resistance trendline since deviating above the $28,000 resistance area on October 2. The decrease led to a low of $26,538 on October 11.
Read More: 9 Best Crypto Demo Accounts For Trading
The price has increased since and is in the process of breaking out from the trendline. It has moved significantly above the line but has yet to reach a close above it.
If BTC breaks out from the $28,000 resistance area, it can increase by another 13% and reach $31,500.

Despite this bullish Bitcoin prediction, a rejection from the $28,000 area can cause a sharp fall of 4.5% to $26,600.
Bitcoin SV (BSV) Price Approaches $40
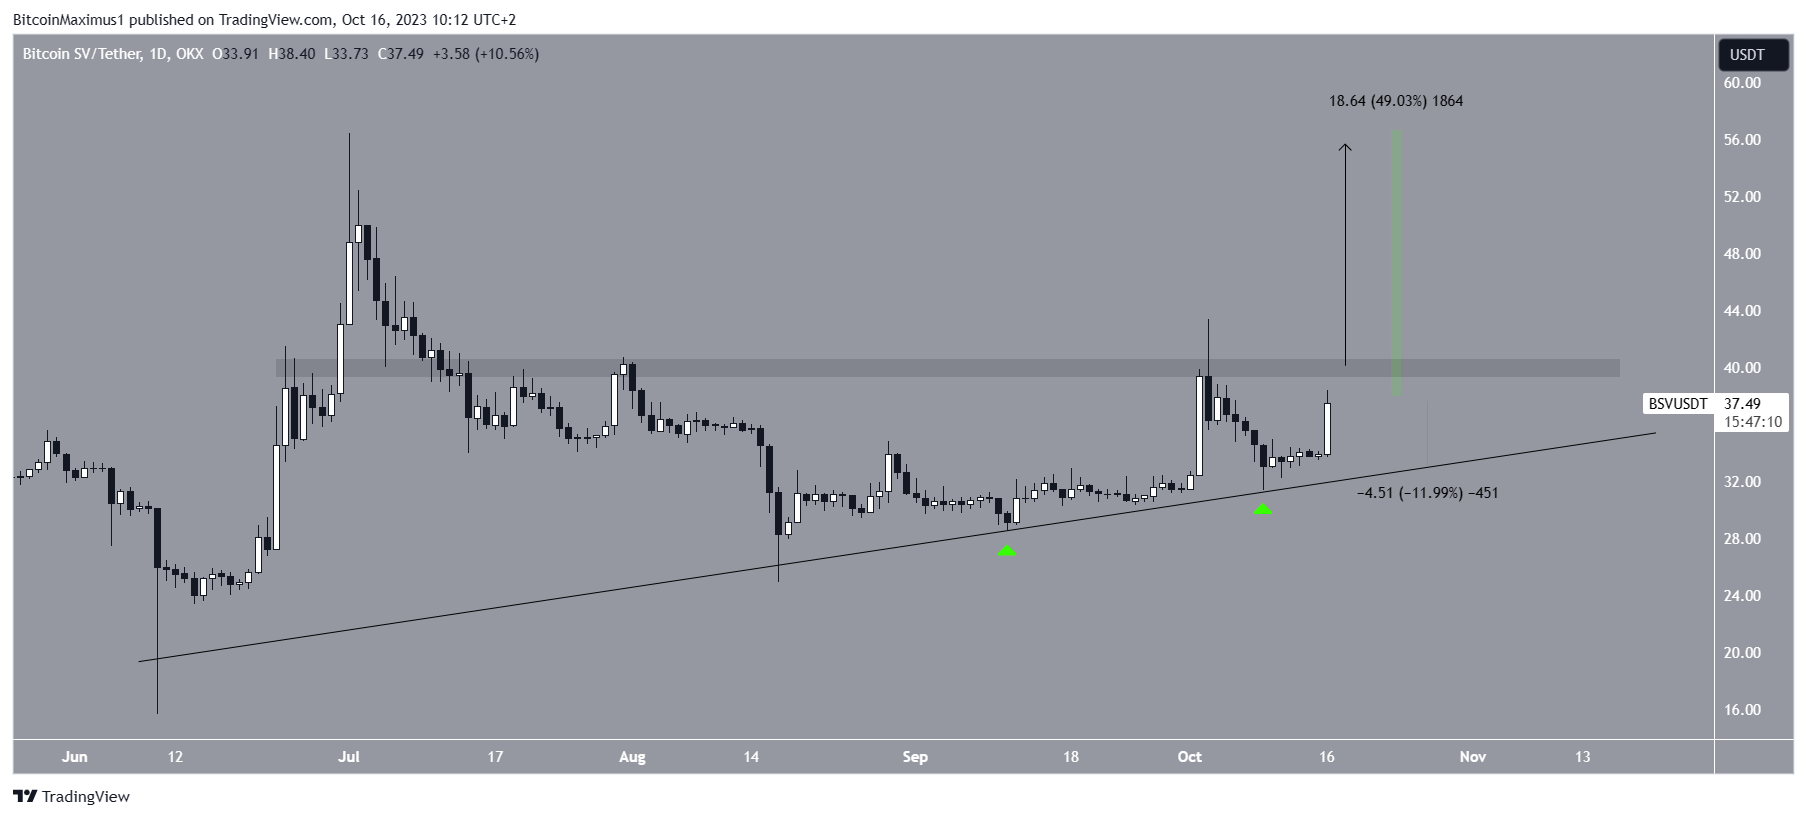
The BSV price has increased alongside an ascending support trendline since June 10. More recently, the price validated the line on September 11 and October 9 (green icons) and accelerated its rate of increase.
BSV is very close to the $50 horizontal resistance area, which has been in place since July. When combined with the ascending support trendline, this creates an ascending triangle, considered a bullish pattern.

A breakout that travels the entire pattern’s height can cause a 50% increase to the next resistance at $56.
On the other hand, a rejection from the $40 area can cause a 12% drop in the ascending support trendline.
Read More: 9 Best AI Crypto Trading Bots to Maximize Your Profits
For BeInCrypto’s latest crypto market analysis, click here.
 beincrypto.com
