Terra is a blockchain protocol that uses fiat-pegged stablecoins to power price-stable global payments systems. According to its white paper, Terra (LUNA) combines the price stability and wide adoption of fiat currencies with the censorship-resistance of Bitcoin (BTC) and offers fast and affordable settlements.
Let us see how the technical analysis of LUNA fares.
Past Performance
Since July, the LUNA price is increasing gradually, with occasional uptrends and downtrends. Despite being volatile, the price has shown a general uptrend. However, during the last week, the price has seen a significant decrease.
On November 15, 2021, the LUNA opened at $51.08. After a weekly decrease of 14.64%, it closed on November 21, 2021, at $43.60. In the last 24 hours, the highest trade took place at $44.90, while the lowest trade took place at $41.09.
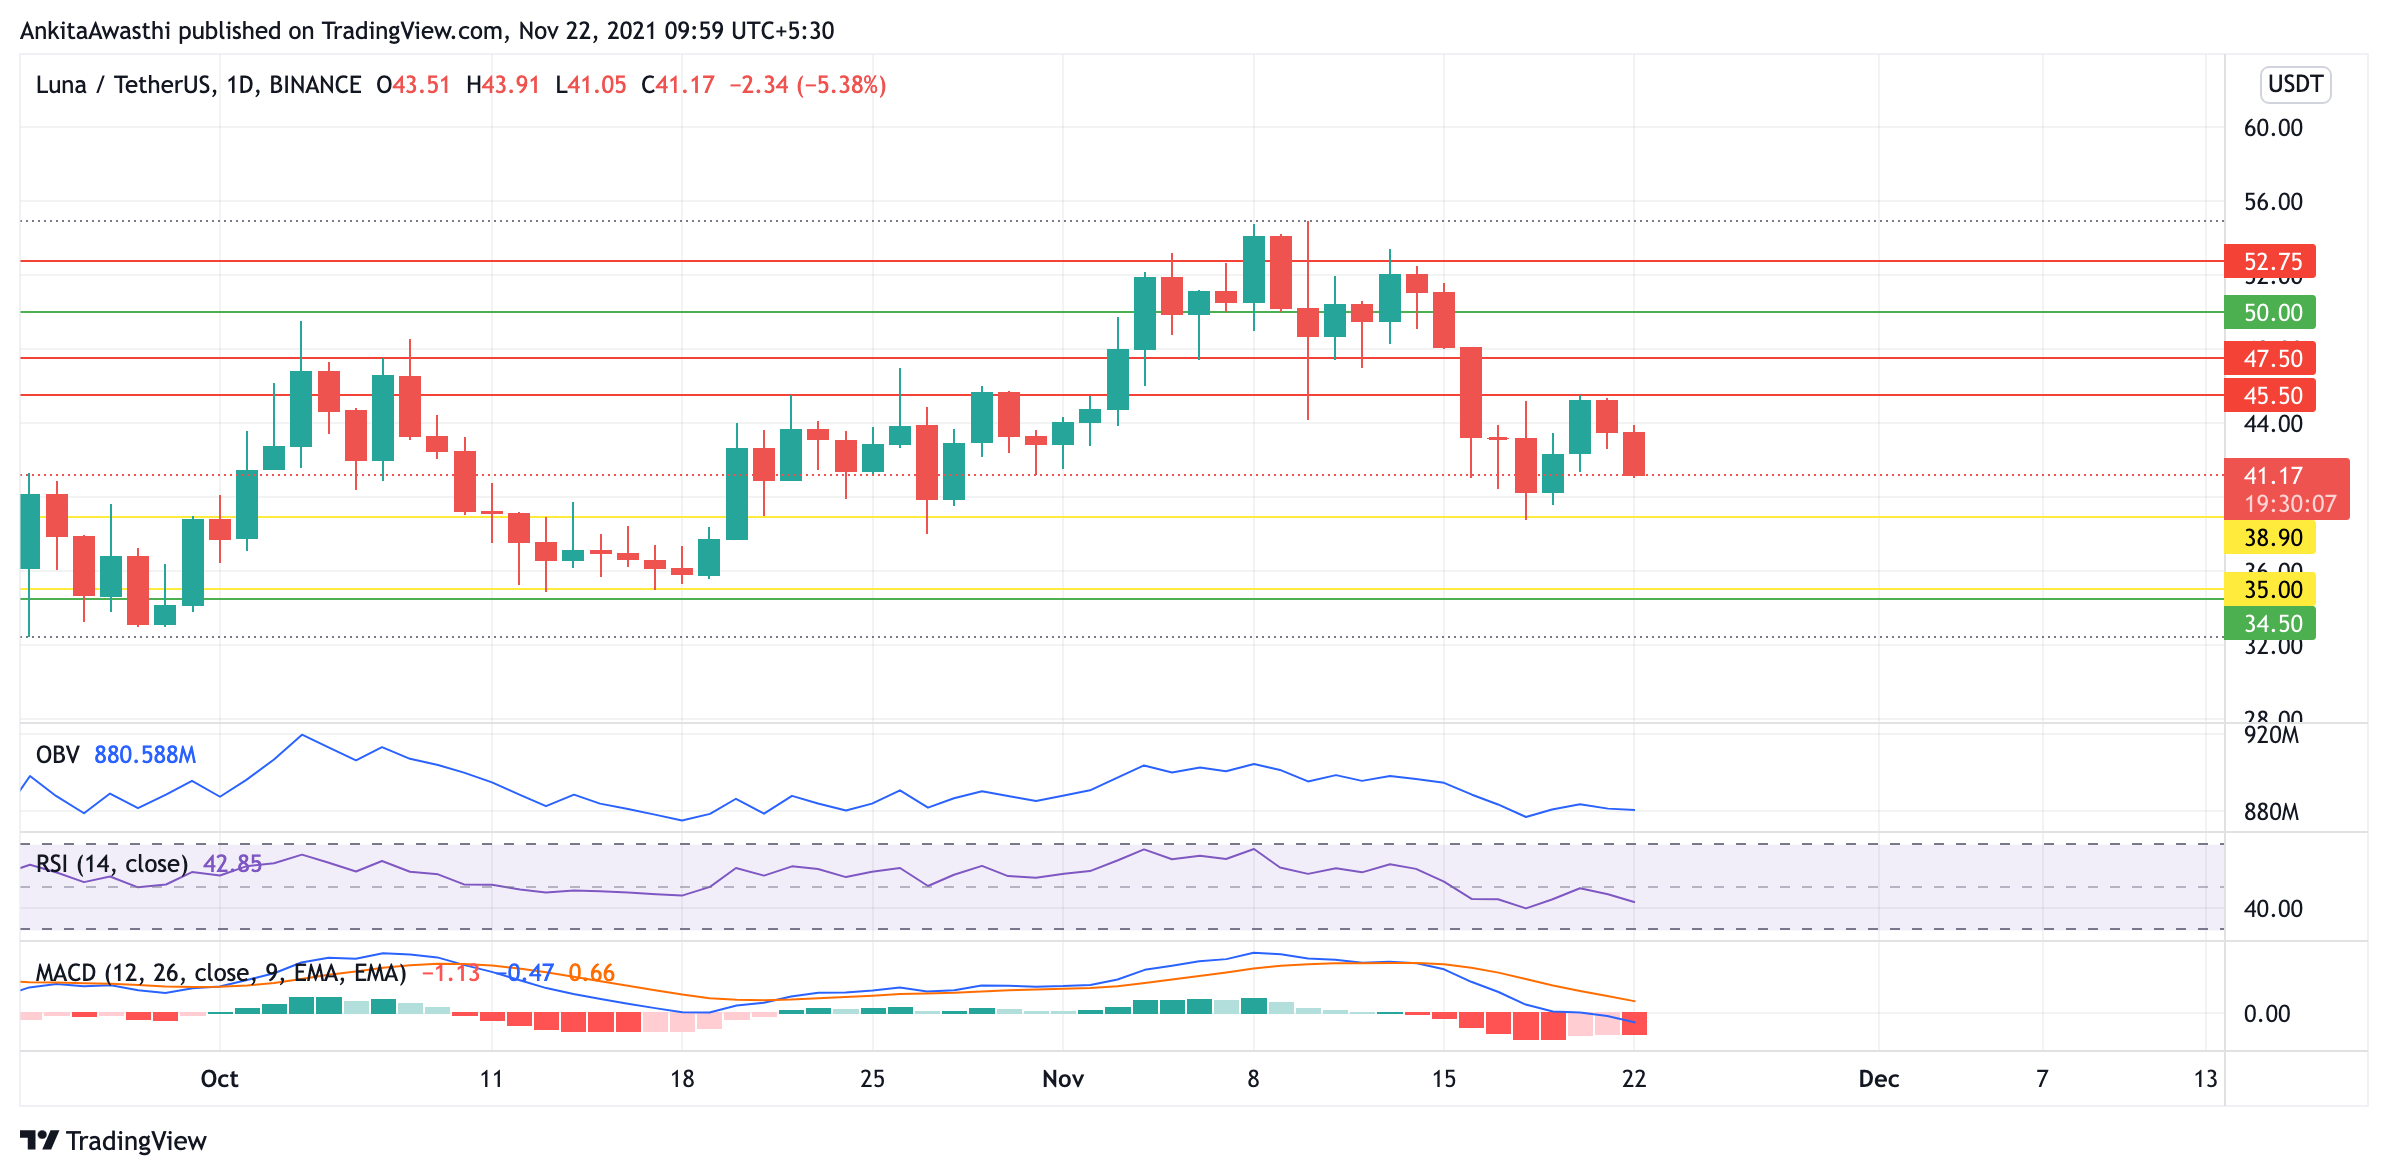
Source: https://www.tradingview.com/x/Hbo966mA/
LUNA Technical Analysis
Following the past week’s decline, the same is expected in the upcoming days, at least till the price takes support at $38.90. If the trend reverses from here, the price may hit the resistance at $45.50. However, breaking this support may lead the price to go on a further downtrend.
According to the On Balance Volume indicator, there is pressure on the price to move downwards, as the selling pressure is higher than the buying pressure for the last two days.
Looking at the RSI graph, we can see that the bulls are losing strength as the trend line has moved below the equilibrium level. Currently, it is at 42.81%.
After the bearish crossover a few days earlier, the fast line of MACD has not recovered yet. Both the fast line and the slow line are negative, while the distance between them is increasing. This is a negative signal for the future of the price.
Day-Ahead and Tomorrow
LUNA coin has been behaving bullishly this year and analysts predict the trend will continue. However, the token has proven volatile, but such peaks and troughs could be attributed to external factors such as the crypto market crash. Remember, this volatility is likely to continue as cryptocurrencies are not stable. You should never invest more than you can afford to lose.
The indicators are predicting that the price is likely to increase in the coming days. However, if the price hits the support at $38.90. Moreover, when the trend reverses, and the rally continues, the traders may keep a target at $50 for the short term.
Looking at the FIB numbers, we can see that the price was tested at the $42.53 pivot point today. The price has dropped below that level and now will be tested at the $39.16 level.