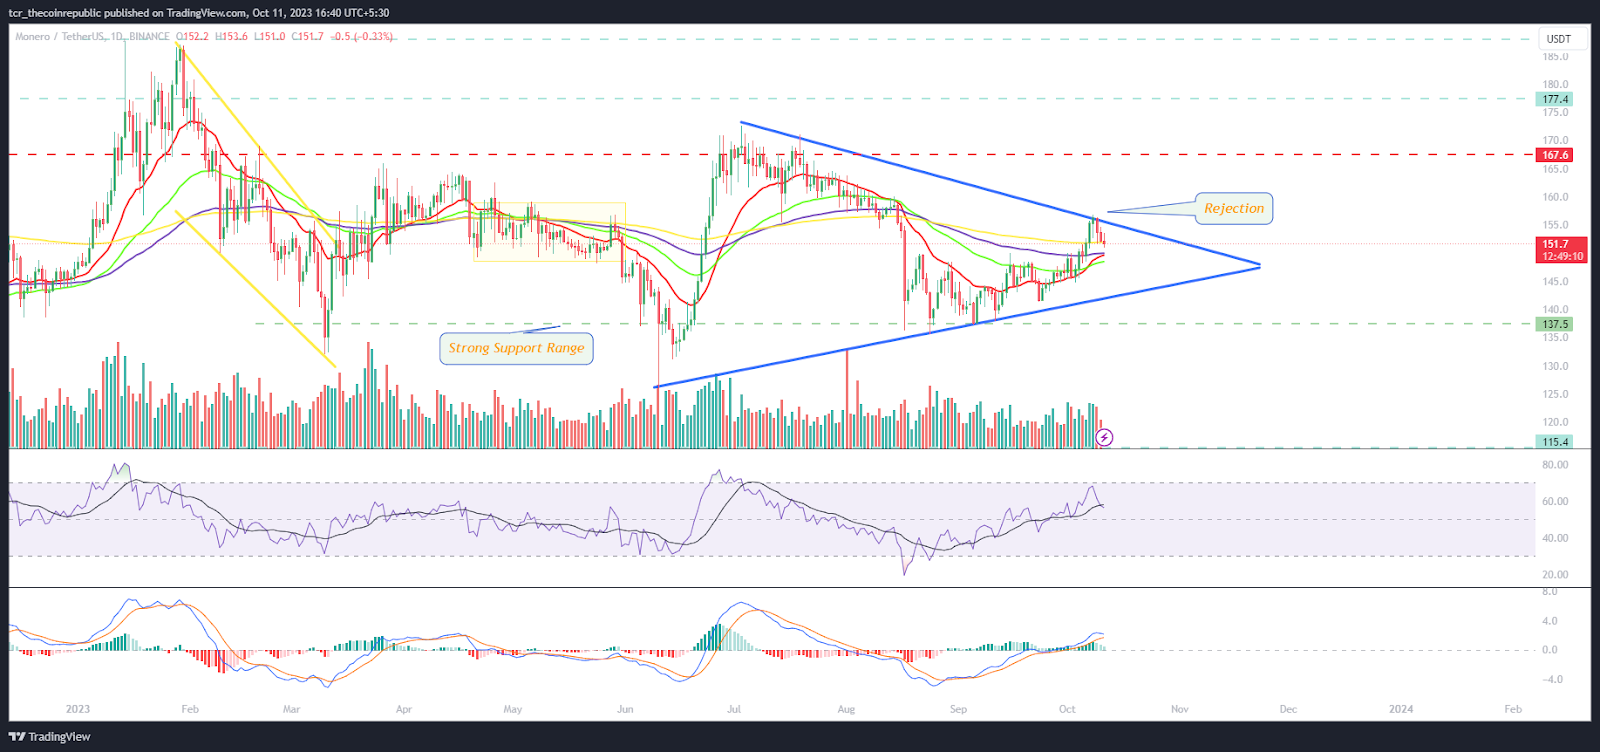
- 1 XMR price is inside the symmetrical triangle pattern on the charts.
- 2 Buyers are looking to surpass the immediate hurdle of $155 to register a breakout.
Monero (XMR) price is trying to surpass the upper trendline of $155 unsuccessfuflly. However, the bulls have attained momentum, and the XMR price is trading above significant moving averages, indicating that bulls are willing to escape the range and will not let back amid rejection. Moreover, the price action shows buyer accumulation and has retested the support zone of $140 in the past sessions.
Monero price is close to the neutral region and is trying to enter into the bull trajectory. Amid bearish sentiments, bulls are trying their best to escape the trendline of $155 and showed their willingness.
XMR price showed volatility and stayed in the congestion zone between the mid trajectory of $140 – $180 for the past weeks. Moreover, the price action shows that buyers have persisted in accumulating, but sellers have spoiled the efforts for the past sessions. However, the XMR price is below the 50% Fib zone. It is trading close to the mid-Bollinger band, indicating that a reversal should be anticipated if the XMR price surpasses the trendline barrier of $155. Besides the volatility, the chart structure shows that if the breakout registers above $155, the XMR price will soon retest the cluster of $170.
At the press time, XMR price is trading at $151.60 with an intraday drop of 0.90%, showing rejection in the past sessions. Moreover, trading volume increased by 2.89% to $61.61 Million, and the pair of XMR/BTC is at 0.00556 BTC. However, the market cap of XMR coin is $2.78 Billion. Furthermore, analysts have maintained neutrality and suggest that XMR will reach $200 soon.
Will XMR Price Surpass Trendline of $155?

On the daily charts, XMR price persisted in facing rejection from the falling trendline and stayed below the neutral region. However, the XMR price is above the significant moving averages and bounced in the past trading sessions. Furthermore, the XMR price is close to the breakout range, showing buyers’ efforts and interest in escaping the region.
The RSI curve stayed in the overbought zone and showed a bullish divergence, suggesting a significant upside toward $170 can be anticipated in the following sessions.The MACD indicator shows a bullish crossover and green bars on the histogram, suggesting a positive outlook for the following sessions.
Summary
XMR price is above the significant moving averages and tried to break out above the trendline barrier of $155. The price action shows buyers are trying to attain momentum and would be looking to defeat the bears soon. Furthermore, the chart shows that the XMR price is close to the trendline and indicates that the XMR price will surpass the trajectory swing of $155 in the following sessions.
Technical Levels
Support Levels: $150 and $140
Resistance Levels: $155 and $165
Disclaimer
The views and opinions stated by the author or any other person named in this article are for informational purposes only and do not constitute financial, investment, or other advice. Investing in or trading crypto or stocks comes with a risk of financial loss.
 thecoinrepublic.com