Bitcoin (BTC) is witnessing a tough tussle near the $58,000 mark but that has not stopped select altcoins from hitting a new all-time high. This shows that traders are watching the fundamental developments on individual coins.
One of the recent top performing major altcoins has been Avalanche (AVAX), which has soared more than 120% in November. The coin caught traders’ attention leading up to the announcement by accounting firm Deloitte which plans to build its disaster relief platforms on the Avalanche blockchain.
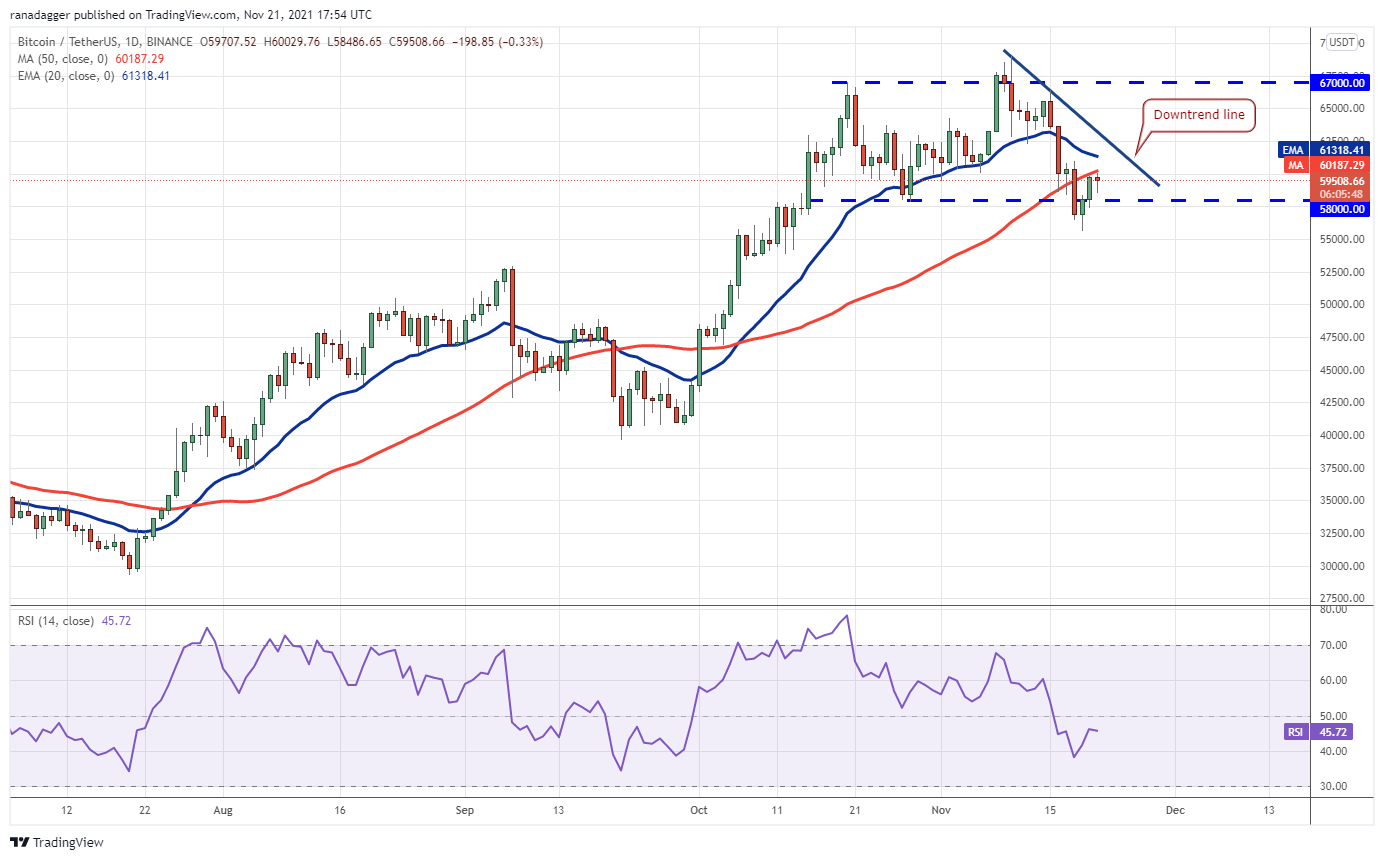
If the price turns down from the current level, the bears will attempt to extend the correction by pulling the BTC/USDT pair below $55,600. If that happens, the next stop could be the strong support zone at $52,500 to $50,000.
If the price rebounds off this zone, the bulls will try to push the pair above the moving averages and the downtrend line. Such a move will indicate that the corrective phase may be over. The bulls will then try to drive the price above the all-time high at $69,000.
Alternatively, a break below the psychological support at $50,000 could intensify selling as traders rush to the exit. The pair could then drop to $45,000 and later to $40,000.
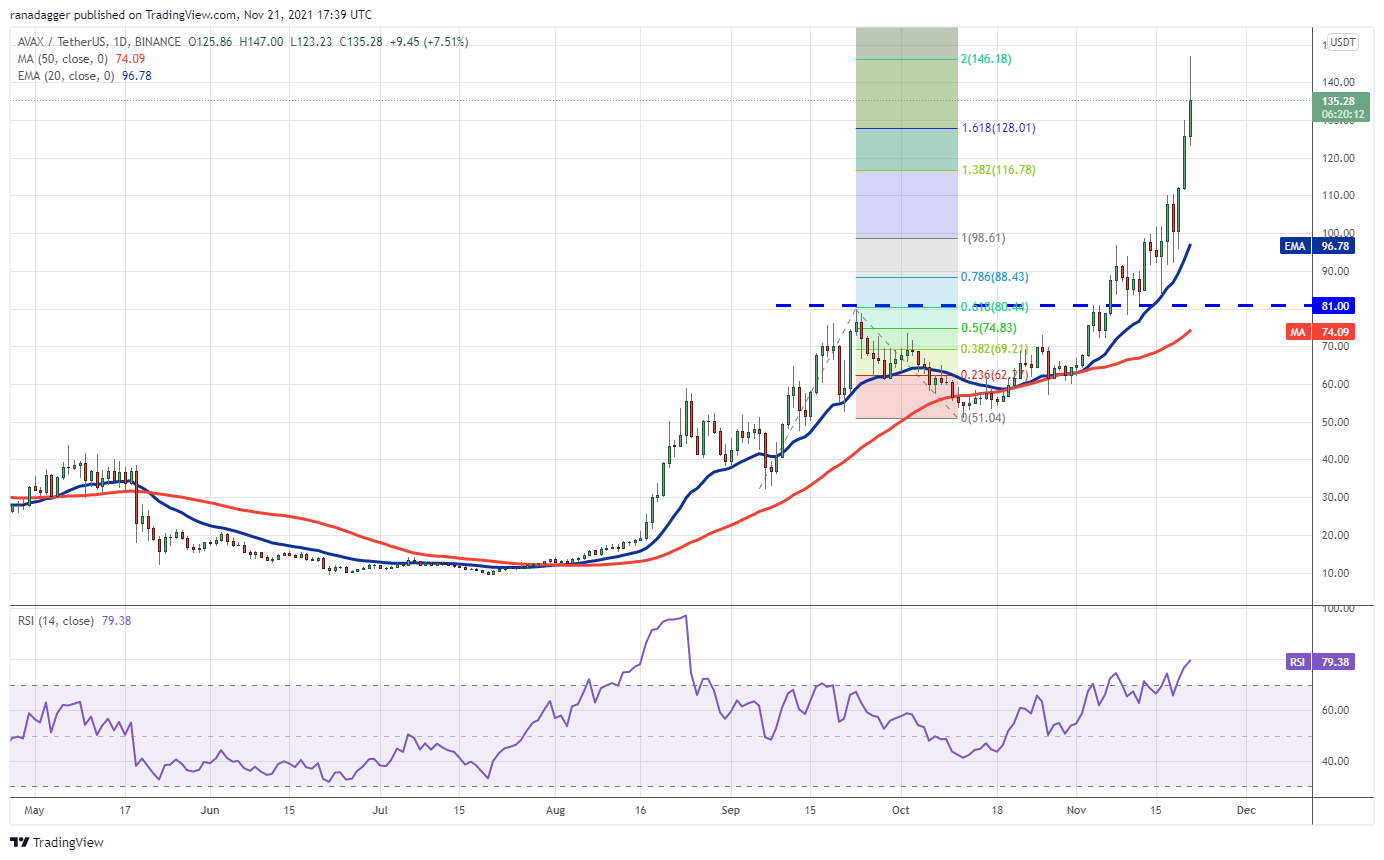
The rising 20-day EMA (96) indicates that bulls are in command but the RSI near 80 suggests that the rally may be overheated in the near term. This could result in a minor correction or consolidation in the next few days.
If the price turns down from the current level, $110 and then the 20-day EMA may act as a strong support. A sharp rebound off either level will suggest that the bulls are viewing the dips as a buying opportunity. The pair could then march toward the 261.8% Fibonacci extension level at $175.58.
Contrary to this assumption, if the price breaks below the 20-day EMA, it will suggest that traders are rushing to the exit. That may pull the AVAX/USDT pair to $81.
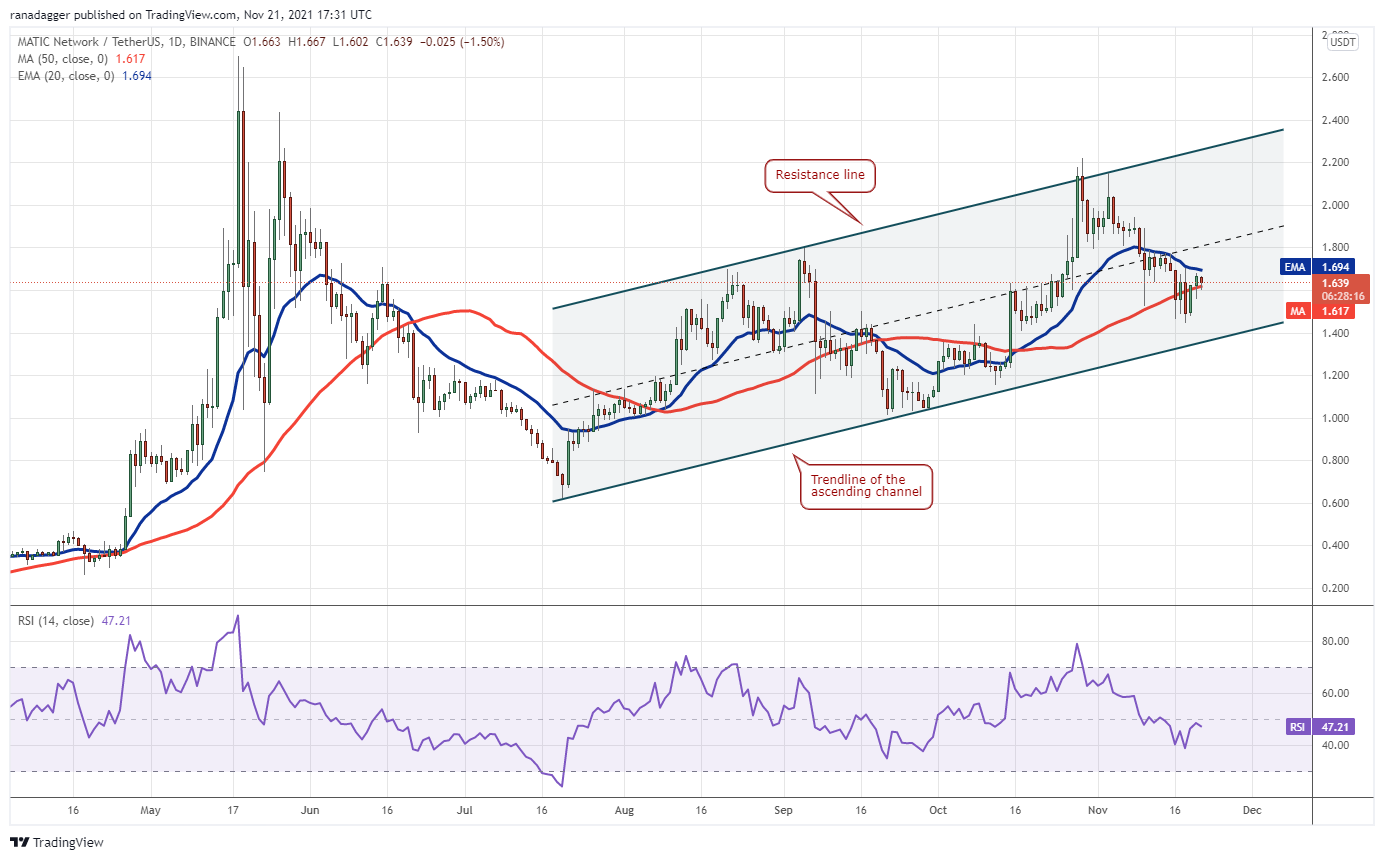
The bears again successfully defended the resistance line on Nov. 3. This started the downward journey toward the trendline of the channel. The downsloping 20-day EMA ($1.69) and the RSI just below the midpoint indicate a minor advantage to sellers.
If the price turns down from the current level, the MATIC/USDT pair could drop to the trendline. The bulls are expected to defend this level aggressively. If the price rebounds off the trendline and rises above the 20-day EMA, it will indicate that the selling pressure may be reducing. That may signal the start of the northward journey toward the resistance line.
Contrary to this assumption, if bears sink the price below the trendline, it could result in a decline to the psychological support at $1.
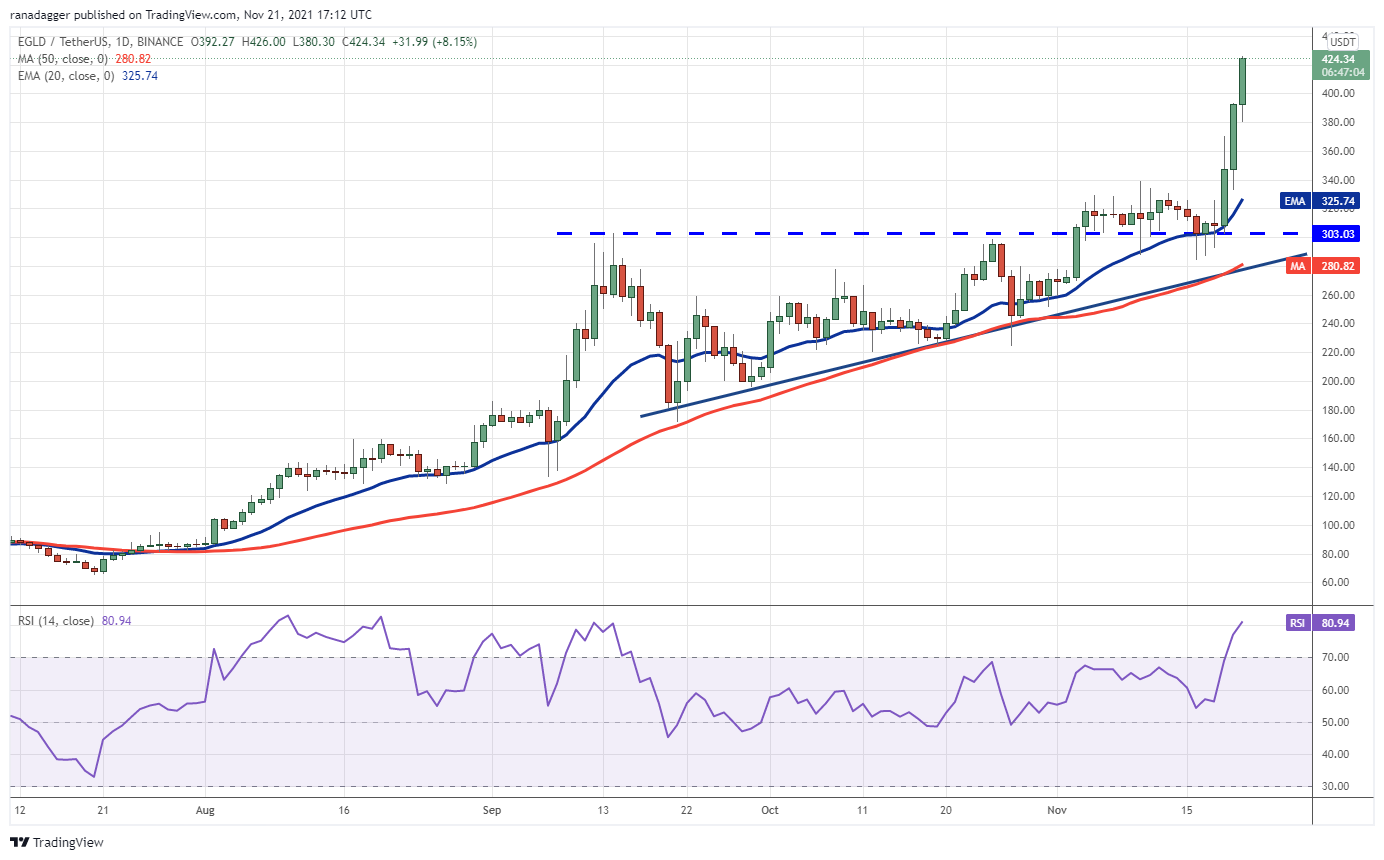
This resumed the uptrend and the EGLD/USDT pair has reached near its pattern target at $427. The sharp rally has pushed the RSI deep into the overbought zone, suggesting that a minor consolidation or correction could be around the corner.
The first support on the downside is the breakout level at $338.70 and then the 20-day EMA ($325). If the price rebounds off either level, it will suggest that traders continue to buy on dips. The bulls will then try to resume the uptrend with the next target objective at $500.
This positive view will be invalidated if the price turns down and plummets below the breakout level at $303.
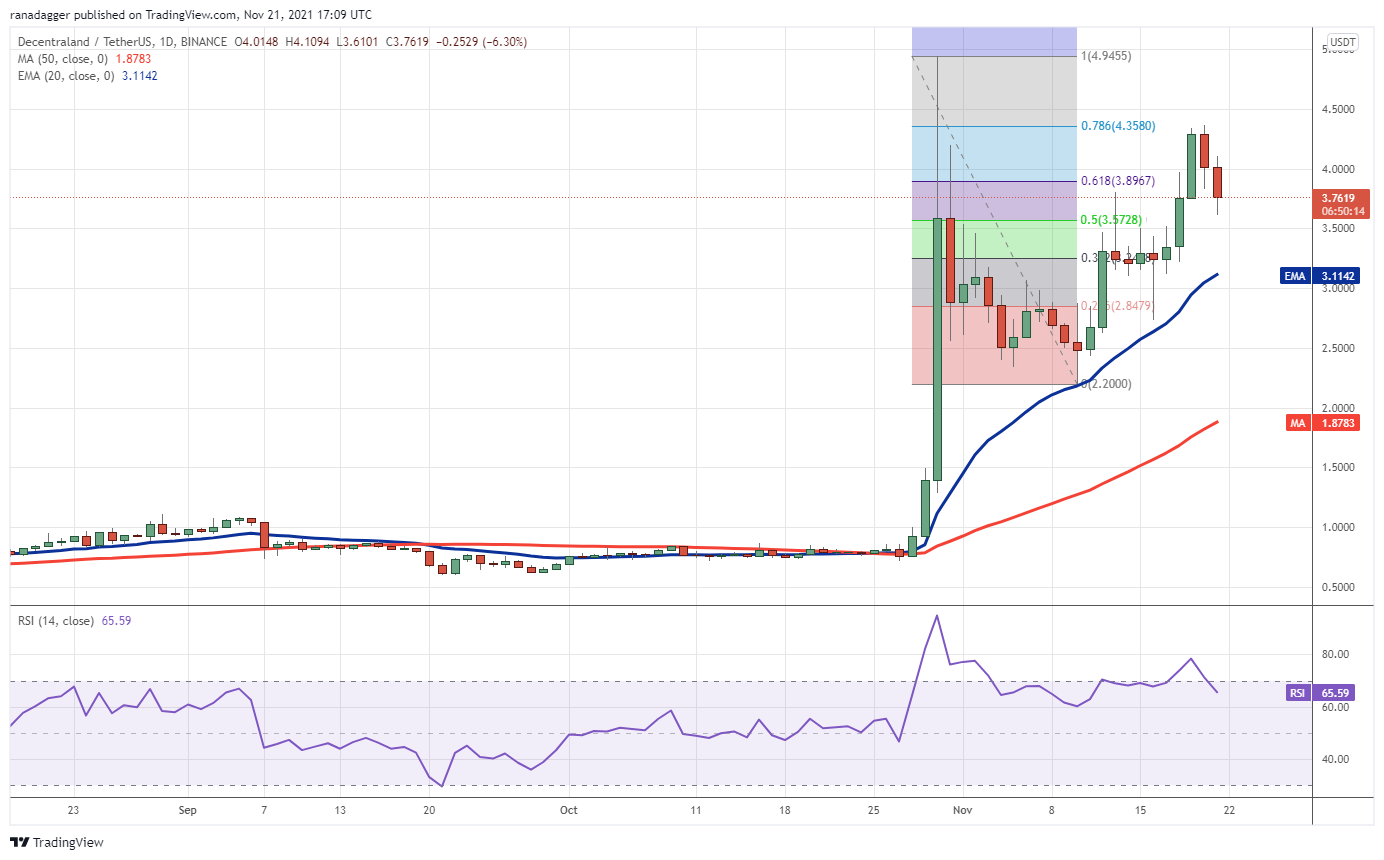
The MANA/USDT pair could now drop to the immediate support at $3.50 and if this level gives way, the correction could deepen to the 20-day EMA ($3.11). If the price rebounds off either support, it will suggest that sentiment remains positive and traders are buying on dips.
The bulls will then attempt to push the price to $4.36. A break and close above this resistance could open the doors for a rally to $4.94. This positive view will invalidate if the price continues lower and breaks below the 20-day EMA.
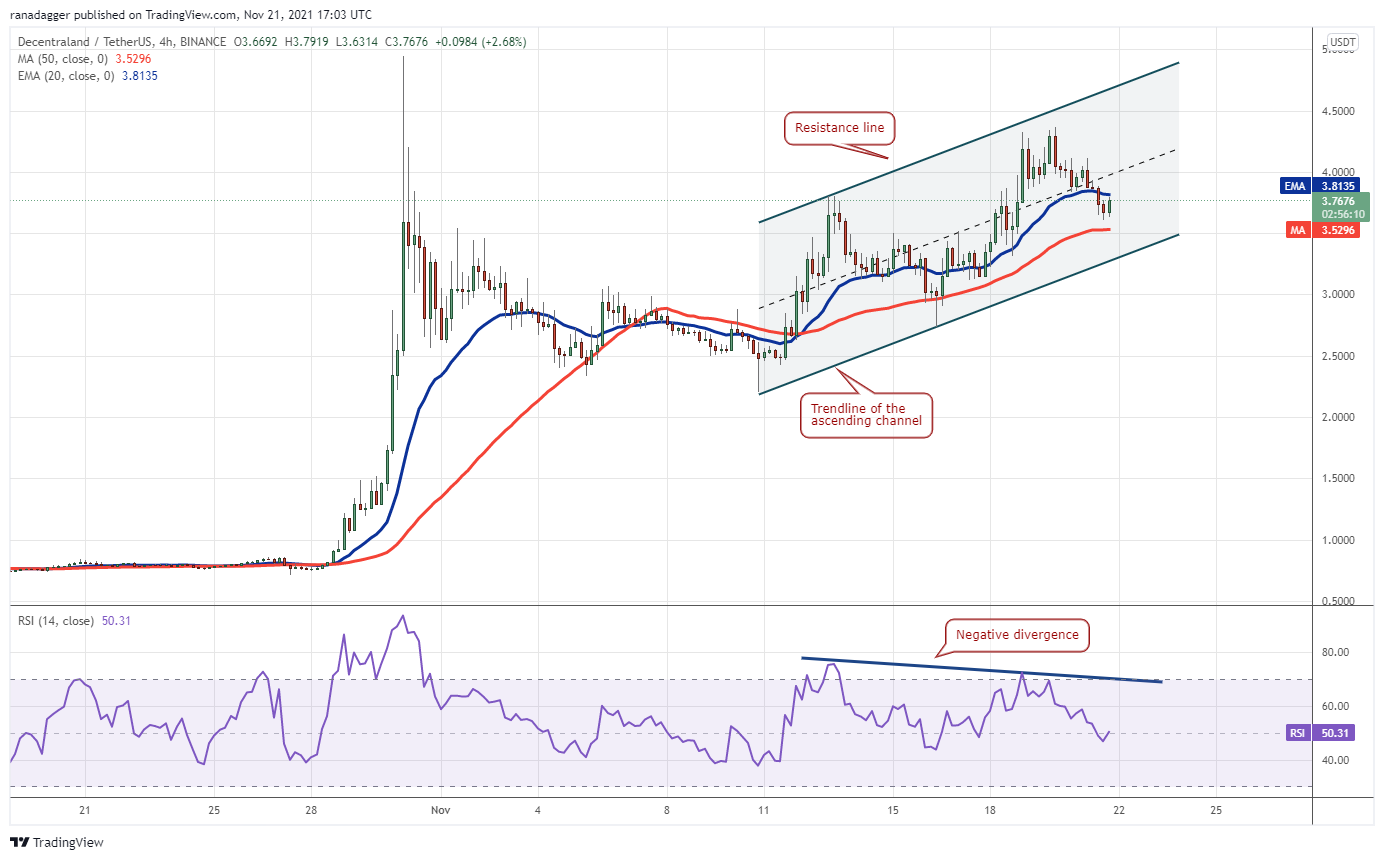
The pair has been rising inside an ascending channel pattern. The failure of the bulls to push the price above the resistance line may have prompted selling from traders, pulling the price below the 20-EMA.
Both moving averages have flattened out and the RSI has dipped near the midpoint, suggesting that the bullish momentum may be weakening. The pair could now drop to the trendline of the channel where buying may emerge.
If the price rebounds off the trendline, the pair could continue its up-move inside the channel. The buyers will then try to push the price to the resistance line. The bullish momentum could pick up on a break and close above the channel.
The views and opinions expressed here are solely those of the author and do not necessarily reflect the views of Cointelegraph. Every investment and trading move involves risk, you should conduct your own research when making a decision.