- Price has crossed $41.6 today.
- Polkadot price analysis favor bulls.
- Support for DOT is $38.41.
The Polkadot price analysis shows that the bulls have succeeded in making a comeback during the last 24-hours after a long bearish interval. A significant amount of recovery in DOT value has been observed as the price has increased up to $41.59 because of the latest upturn. The past few weeks proved extremely detrimental for the overall coin value, but now the situation is turning favorable for the buyers because of the increasing trend.
DOT/USD 1-day price chart: Cryptocurrency value bounces back to $41.6 after boost
The one-day Polkadot price analysis is showing signs of an upward trend as more buying activity has taken place in the last 24-hours. The buyers are putting in their efforts to maintain the bullish lead and the price has been uplifted to $41.59. Although the last two weeks proved quite damaging for the market value of DOT/USD, the past few days have brought positive consequences. The price is yet to cross the moving average (MA) value i.e. $43.31.
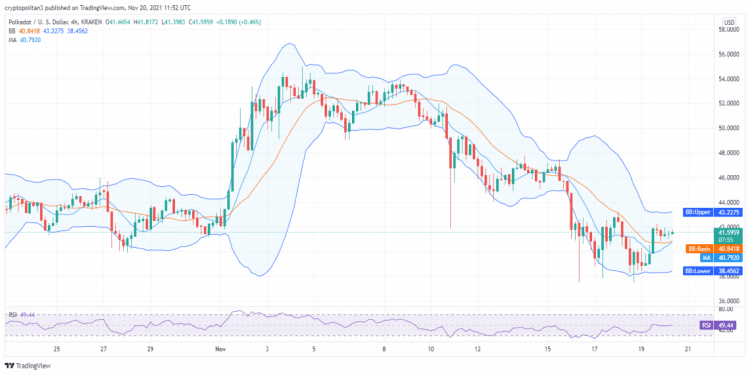
A crossover between SMA 20 and SMA 50 curves is highly expected in the next few hours as the bullish trend is getting stronger. The Bollinger Bands Indicator is now showing the following values; the upper Bollinger band value is $43.22 whereas the lower Bollinger band value is $38.45. The RSI score is entering the neutral zone now and has just crossed 49.
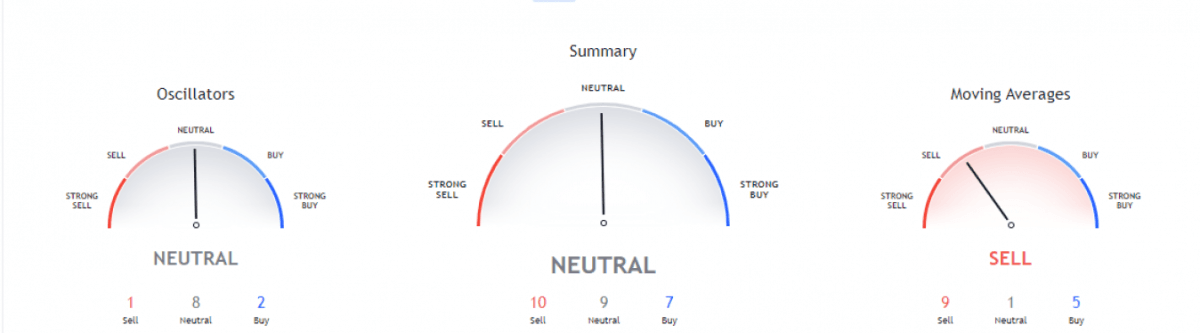
The market is observing a neutral trend as a constant fluctuation in price movements has been ongoing for the past couple of weeks. We can see 10 indicators standing on the selling mark, nine indicators are on the neutral mark while only seven indicators are on the buying mark.
The Moving Averages Indicator is supporting the sellers by giving out a bearish hint. A total of nine indicators are now occupying the selling position, while five indicators are on the buying and one indicator is on the neutral position. The Oscillators are indicating a neutral trend for the day as well as nine oscillators are on the neutral point, two oscillators are on the buying point and one oscillator is on the selling point.
Polkadot price analysis conclusion
The daily and hourly predictions for DOT/USD are supporting the buyers today as a bullish price movement is taking place. The price is on its way to recovery and has increased up to $41.59 because of the upward trend. If the bulls remain persistent, further improvement in the coin value is to follow in the approaching week.
Disclaimer. The information provided is not trading advice. Cryptopolitan.com holds no liability for any investments made based on the information provided on this page. We strongly recommend independent research and/or consultation with a qualified professional before making any investment decisions.