The bullish reversal near the $1.5 mark drives the FLOW coin price 10% higher in the last 24 hours. Will it be enough to break above the $13 mark?
Flow is a fast and decentralized blockchain that developers can use to build new games and apps. Flow is the layer-one blockchain that was initially developed by a team that has delivered consistently excellent consumer blockchain experiences, including CryptoKitties and Dapper Wallet.
Let us now learn about the technical analysis of the FLOW.
Past Performance of FLOW
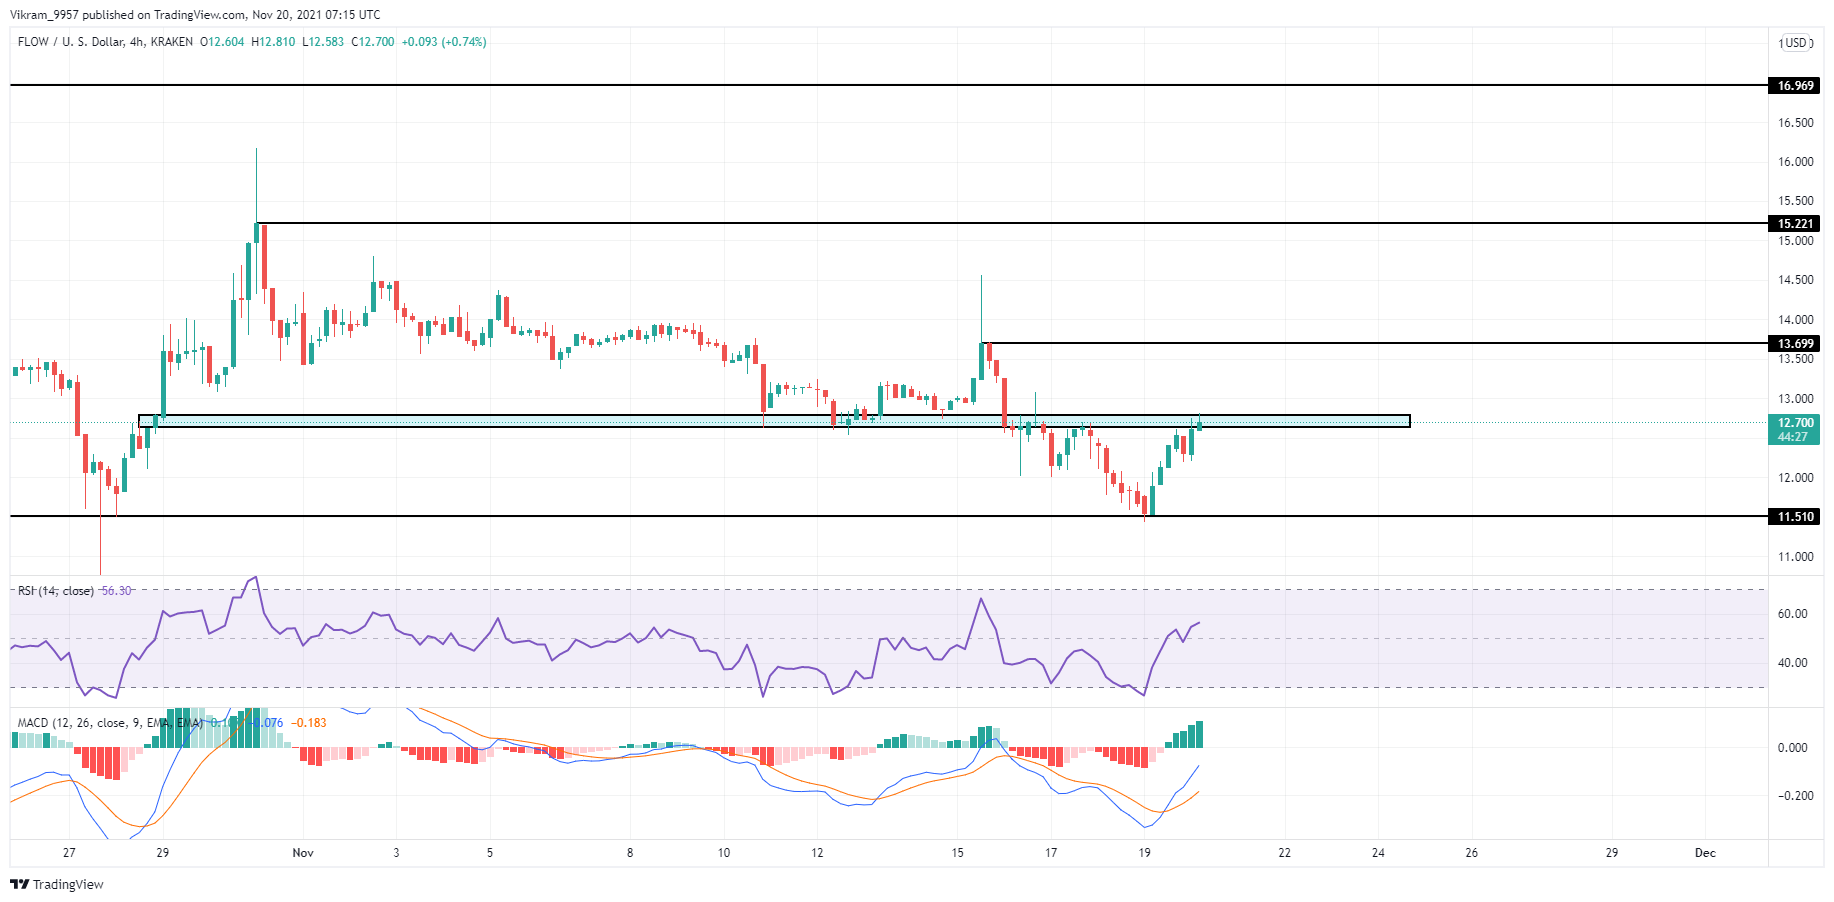
The fallout of the support near slightly below the $13 mark drove the FLOW coin prices lower to the $11.5 mark. However, the demand near the level pushes the price 10% higher in the last 24 hours. Thus, resulting in a quick bullish reversal in the 4-hour chart.
Nonetheless, the $13 zone acts as a crucial resistance that has pushed the price once. Hence, the bull run requires a breakout of $13.
FLOW/USD Daily Chart
FLOW Technical Analysis
The FLOW coin price action seems to be in the making of an inverted head and shoulder pattern in the 4-hour chart. Hence, the breakout of the $13 mark seems imminent.
The breakout of the $13 mark can lead to a bull run that may face near the $13.75 and $15 mark, as per the Pivot Points. Also, the support levels are at the $12 and $10.50 mark.
The RSI slope climbs above the 50%ine in the 4-hour chart, with a gradual rise from the oversold zone. Moreover, the indicator shows a bullish divergence in the last two dips at the $11.5 mark in the daily chart. Hence, the RSI indicator sides with the bulls in the short and long term.
The MACD indicator shows the MACD and seller’s lines increase the distance between them after the bullish crossover in the 4-hour chart. Moreover, the lines give a bullish crossover in the daily chart. Hence, the MACD indicator gives bullish signals for the FLOW coin.
The Stochastic RSI shows both the K and D lines rising higher after the bullish crossover near the oversold zone. Moreover, the last lines show bullish divergence in the daily chart. Thus, it indicates a bullish signal.
Upcoming Trend
Flow is a blockchain designed for mainstream adoption. It is the only blockchain to incorporate usability improvements in the protocol layer. The blockchain is being used by top developers and major brands around the globe to create new experiences using top-tier content.
The downtrend in the daily chart showcases weakness in the 4-chart due to the demand near the $11.5 mark. Moreover, the possible inverted head and shoulder pattern in the 4-hour can result in the $13 breakout.
Moreover, the technical indicators forecast the possibility of a bullish reversal in the 4-hour and daily chart. Hence, traders can expect the FLOW coin price to reach the $20 mark in the next few weeks.