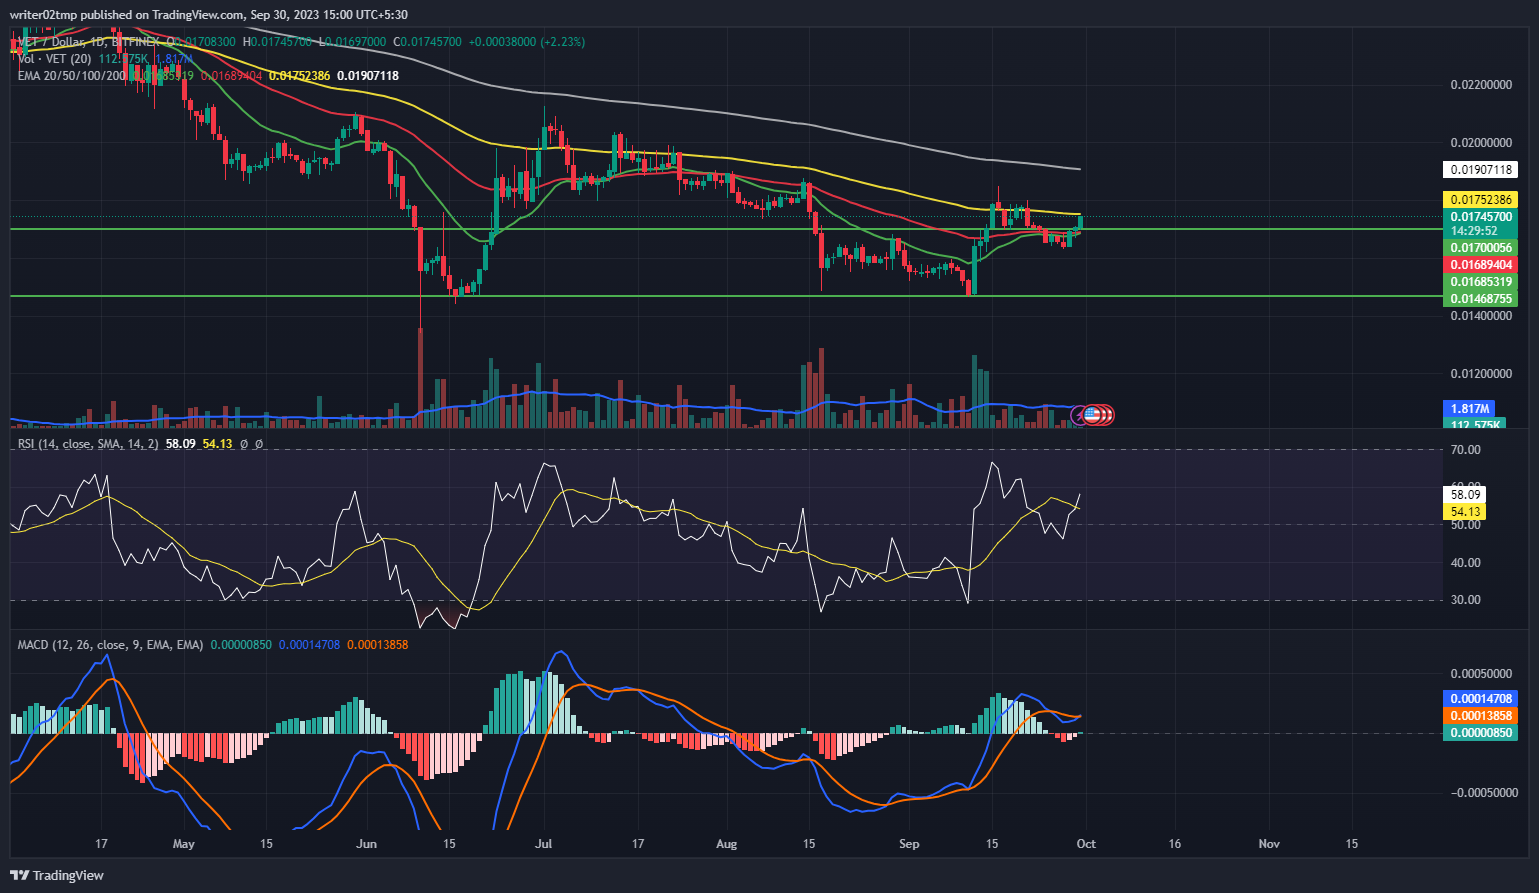
- 1 VeChain price prediction showcases the uptrend in VET crypto over the daily time frame chart.
- 2 VET crypto is above the 20 and 50-EMAs to reach the 100 and 200-days daily moving averages.
- 3 VeChain cryptocurrency gained around 9.73% year to date.
VeChain price prediction showcases the recovery of VET crypto as it broke out of the consolidation phase over the daily time frame chart. Meanwhile, trading volume needs to rise in favor of buyers to push VET ahead of the upper threshold. However, volume change is below average and needs to grow in favor of buyers intraday. Buyers need to accumulate at a higher rate in order to push VET crypto and let it sustain at the present level.
VeChain price was at $0.01745700 and has gained around 2.23% of its market capitalization during the day’s trading session. Trading volume has increased by 8.32% intraday. This demonstrates that buyers are trying to push VET ahead of the upper threshold. Volume to market cap ratio was at 2.03%.
Analyzing VeChain Price Technical Indications
 VET Crypto Sustain the Breakout?">
VeChain price has broken out of the consolidation phase and is currently trying to sustain above the upper price range of the consolidation phase. Meanwhile, buyers need to maintain their accumulation rate to push VET crypto upwards and avoid slipping back inside the consolidation phase. However, volume change is below average which needs to grow in favor of buyers intraday. Meanwhile, VET crypto is above the 20 and 50-EMAs to reach the 100 and 200-days daily moving averages.
VeChain cryptocurrency saw a modest gain of approximately 1.35% over the past week and a more significant increase of 6.57% within the month. However, it experienced losses of 15.61% over the past three months and 25.60% over the last six months. Nonetheless, VeChain managed to secure a gain of about 9.73% year-to-date.
Technical indicators highlight the current uptrend in VET crypto’s price. The relative strength index (RSI) demonstrates a positive trend for VET, and the moving average convergence divergence (MACD) confirms the upward momentum.
With the RSI at 58, it is approaching the overbought zone. Additionally, the MACD line is crossing above the signal line, indicating a positive crossover. Investors in VeChain cryptocurrency should monitor these trends closely.
Summary
VeChain price prediction showcases the recovery of VET crypto as it broke out of the consolidation phase over the daily time frame chart. However, volume change is below average and needs to grow in favor of buyers intraday. Nonetheless, VeChain has managed to secure a gain of about 9.73% year-to-date. Technical indicators highlight the current upward trend in VET crypto’s price. Investors in VeChain cryptocurrency should monitor these trends closely.
Technical Levels
- Support Levels: $0.01669120 and $0.01639756
- Resistance Levels: $0.01776214 and $0.01853944
Disclaimer
The views and opinions stated by the author, or any people named in this article, are for informational purposes only, and they do not establish financial, investment, or other advice. Investing in or trading crypto or stock comes with a risk of financial loss.
 thecoinrepublic.com
